SDO HMI 2014-09-11 18:00:35 UT
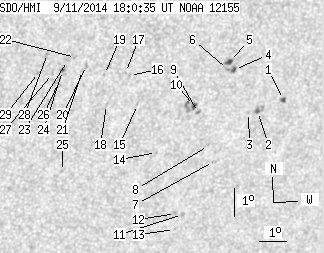
See sunspots with tool (Click here to study sunspot positions and configurations with tool using white-light and magnetogram images and polarity drawing)
(It is recommended to set high resolution on your display!)
| group | Proj. U | Proj. WS | Corr. U | Corr. WS | B | L | LCM | Pos. angle | r | MU | MP |
| 7.57 | 57.67 | 4.85 | 36.49 | -20.03 | 106.34 | 27.51 | 224.17 | 0.6235 | 109.0 | 166.9 | |
|
previous
or next observation for the same group /
back to the solar disc SDO HMI 2014-09-11 18:00:35 UT
See sunspots with tool (Click here to study sunspot positions and configurations with tool using white-light and magnetogram images and polarity drawing) (It is recommended to set high resolution on your display!) |
| spot | Proj. U | Proj. WS | Corr. U | Corr. WS | B | L | LCM | Pos. angle | r | MU | MP |
| 1.25 | 2.85 | 0.82 | 1.88 | -20.16 | 110.55 | 31.72 | 228.12 | 0.6652 | 730.3 | 492.8 | |
| 0.89 | 6.05 | 0.58 | 3.98 | -20.50 | 109.65 | 30.82 | 226.92 | 0.6593 | 766.0 | 529.4 | |
| 0.00 | 1.25 | 0.00 | 0.82 | -20.51 | 109.31 | 30.48 | 226.60 | 0.6562 | 626.0 | 460.7 | |
| 1.25 | 2.58 | 0.80 | 1.65 | -19.01 | 108.48 | 29.65 | 227.63 | 0.6353 | 757.6 | 627.5 | |
| 2.05 | 3.74 | 1.30 | 2.38 | -18.72 | 108.24 | 29.41 | 227.76 | 0.6305 | 936.6 | 799.4 | |
| 0.00 | 0.98 | 0.00 | 0.62 | -18.99 | 108.22 | 29.39 | 227.41 | 0.6326 | 682.0 | 677.3 | |
| 0.00 | 1.87 | 0.00 | 1.23 | -22.12 | 108.37 | 29.53 | 223.87 | 0.6613 | 427.0 | 340.5 | |
| 0.00 | 1.16 | 0.00 | 0.75 | -21.55 | 108.05 | 29.22 | 224.21 | 0.6534 | 658.0 | 509.6 | |
| 0.00 | 1.96 | 0.00 | 1.26 | -20.39 | 107.43 | 28.60 | 224.97 | 0.6373 | 563.0 | 444.0 | |
| 1.69 | 8.99 | 1.08 | 5.73 | -20.14 | 107.24 | 28.41 | 225.07 | 0.6331 | 850.1 | 702.5 | |
| 0.00 | 1.87 | 0.00 | 1.24 | -23.91 | 107.62 | 28.79 | 221.20 | 0.6708 | 457.0 | 352.0 | |
| 0.00 | 1.33 | 0.00 | 0.89 | -23.86 | 107.35 | 28.52 | 220.99 | 0.6680 | 678.0 | 567.5 | |
| 0.00 | 0.98 | 0.00 | 0.65 | -24.43 | 107.45 | 28.62 | 220.48 | 0.6741 | 381.0 | 313.3 | |
| 0.00 | 0.80 | 0.00 | 0.51 | -21.67 | 106.16 | 27.32 | 222.21 | 0.6372 | 520.0 | 454.0 | |
| 0.00 | 0.89 | 0.00 | 0.56 | -19.97 | 105.14 | 26.31 | 223.11 | 0.6118 | 514.0 | 424.5 | |
| 0.00 | 1.33 | 0.00 | 0.82 | -18.97 | 104.68 | 25.85 | 223.82 | 0.5977 | 641.0 | 525.3 | |
| 0.00 | 0.36 | 0.00 | 0.22 | -18.86 | 104.52 | 25.69 | 223.78 | 0.5951 | 667.0 | 689.2 | |
| 0.00 | 0.53 | 0.00 | 0.33 | -19.90 | 104.02 | 25.19 | 221.97 | 0.6007 | 557.0 | 370.7 | |
| 0.00 | 0.98 | 0.00 | 0.60 | -18.88 | 103.78 | 24.95 | 222.93 | 0.5883 | -692.0 | -517.5 | |
| 0.00 | 1.69 | 0.00 | 1.02 | -18.54 | 103.10 | 24.27 | 222.56 | 0.5783 | -766.0 | -585.2 | |
| 0.00 | 1.16 | 0.00 | 0.70 | -18.70 | 102.98 | 24.15 | 222.23 | 0.5788 | -549.0 | -407.7 | |
| 0.00 | 1.33 | 0.00 | 0.80 | -18.25 | 102.67 | 23.84 | 222.42 | 0.5713 | -601.0 | -479.5 | |
| 0.00 | 1.96 | 0.00 | 1.18 | -18.33 | 102.41 | 23.58 | 222.00 | 0.5696 | -720.0 | -572.2 | |
| 0.44 | 2.22 | 0.27 | 1.34 | -18.66 | 102.28 | 23.45 | 221.45 | 0.5718 | -857.2 | -768.5 | |
| 0.00 | 1.07 | 0.00 | 0.67 | -22.12 | 102.85 | 24.02 | 218.14 | 0.6128 | -613.0 | -522.8 | |
| 0.00 | 4.45 | 0.00 | 2.69 | -19.06 | 102.20 | 23.37 | 220.87 | 0.5751 | -695.0 | -556.7 | |
| 0.00 | 0.89 | 0.00 | 0.54 | -18.74 | 101.95 | 23.12 | 220.94 | 0.5695 | -759.0 | -676.9 | |
| 0.00 | 0.98 | 0.00 | 0.58 | -18.06 | 101.68 | 22.85 | 221.45 | 0.5598 | -803.0 | -676.1 | |
| 0.00 | 1.42 | 0.00 | 0.85 | -18.68 | 101.45 | 22.62 | 220.41 | 0.5642 | -726.0 | -582.9 | |
| Proj. U | - Projected umbra area in millionths of solar disc, negative values indicate | |
|
that the umbra consists of fragmented regions which cannot be separated without losing umbral area. In this way several spots (intensity minima in the umbra) have a common umbra, e.g. -2 means that the given spot shares an umbra with spot No.2, and the common U value is indicated at spot No.2. |
||
| Proj. WS | - Projected whole spot area in millionths of solar disc, negative values indicate | |
|
that several umbras have a common penumbra, e.g. -7 means that the given umbra shares a penumbra with umbra No.7, and the WS value is indicated at No.7. |
||
| Corr. U | - Corrected umbra area in millionths of solar hemisphere, for negative values see above | |
| Corr. WS | - Corrected whole spot area in millionths of solar hemisphere, for negative values see above | |
| B | - Heliographic latitude B; positive: North, negative: South | |
| L | - Heliographic longitude L | |
| LCM | - Longitudinal distance from the Sun's central meridian | |
| Pos. angle | - Position angle | |
| r | - Distance from the centre of Sun's disc in terms of Sun's radius | |
| MU | - Mean magnetic field within the umbra contour averaged the pixel values with sign. | |
| MP | - Mean magnetic field within the penumbra contour averaged the pixel values with sign. | |