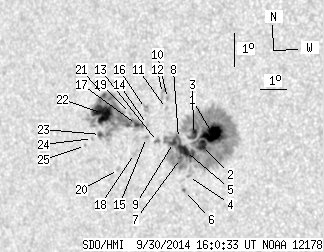
SDO HMI 2014-09-30 16:00:33 UT
See sunspots with tool (Click here to study sunspot positions and configurations with tool using white-light and magnetogram images and polarity drawing)
(It is recommended to set high resolution on your display!)
| group | Proj. U | Proj. WS | Corr. U | Corr. WS | B | L | LCM | Pos. angle | r | MU | MP |
| 84.21 | 446.68 | 53.22 | 280.71 | -1.45 | 151.84 | -37.30 | 101.09 | 0.6194 | 278.7 | 188.3 | |
|
previous
or next observation for the same group /
back to the solar disc SDO HMI 2014-09-30 16:00:33 UT
See sunspots with tool (Click here to study sunspot positions and configurations with tool using white-light and magnetogram images and polarity drawing) (It is recommended to set high resolution on your display!) |
| spot | Proj. U | Proj. WS | Corr. U | Corr. WS | B | L | LCM | Pos. angle | r | MU | MP |
| 20.88 | 298.96 | 12.87 | 185.20 | -1.34 | 153.47 | -35.67 | 101.50 | 0.5971 | 1222.4 | 403.9 | |
| 7.13 | -1.00 | 4.42 | -1.00 | -1.73 | 153.09 | -36.05 | 101.98 | 0.6036 | 937.0 | 999999 | |
| 5.37 | -1.00 | 3.34 | -1.00 | -1.42 | 152.76 | -36.38 | 101.36 | 0.6070 | 723.8 | 999999 | |
| 0.00 | 1.15 | 0.00 | 0.72 | -2.71 | 152.54 | -36.61 | 103.33 | 0.6144 | 641.0 | 499.9 | |
| 13.04 | -1.00 | 8.15 | -1.00 | -1.96 | 152.45 | -36.69 | 102.10 | 0.6130 | 824.4 | 999999 | |
| 0.44 | 1.85 | 0.28 | 1.16 | -3.15 | 152.37 | -36.77 | 103.95 | 0.6182 | -668.2 | -491.8 | |
| 1.15 | -1.00 | 0.72 | -1.00 | -2.19 | 152.25 | -36.89 | 102.38 | 0.6164 | 317.5 | 999999 | |
| 1.23 | -1.00 | 0.77 | -1.00 | -1.58 | 152.20 | -36.95 | 101.40 | 0.6152 | 598.9 | 999999 | |
| 3.17 | -1.00 | 1.99 | -1.00 | -1.72 | 152.00 | -37.14 | 101.54 | 0.6182 | 632.1 | 999999 | |
| 0.00 | 1.41 | 0.00 | 0.89 | -0.40 | 151.80 | -37.34 | 99.38 | 0.6171 | 758.0 | 582.1 | |
| 0.00 | 1.67 | 0.00 | 1.05 | -0.70 | 151.76 | -37.39 | 99.85 | 0.6185 | 753.0 | 540.4 | |
| 0.00 | 4.32 | 0.00 | 2.72 | -0.26 | 151.61 | -37.53 | 99.10 | 0.6192 | 460.0 | 478.9 | |
| 0.62 | 2.99 | 0.39 | 1.90 | -1.73 | 151.40 | -37.75 | 101.34 | 0.6263 | 604.7 | 347.8 | |
| 0.00 | 1.76 | 0.00 | 1.12 | -1.24 | 151.03 | -38.12 | 100.45 | 0.6298 | 515.0 | 369.2 | |
| 0.00 | 2.11 | 0.00 | 1.35 | -1.64 | 150.98 | -38.16 | 101.05 | 0.6316 | 495.0 | 198.5 | |
| 0.00 | 3.52 | 0.00 | 2.24 | -0.76 | 150.96 | -38.19 | 99.68 | 0.6294 | 578.0 | 549.8 | |
| 2.20 | 118.47 | 1.41 | 76.89 | -1.27 | 150.60 | -38.54 | 100.35 | 0.6355 | 540.4 | -409.8 | |
| 0.00 | 3.88 | 0.00 | 2.49 | -2.16 | 150.50 | -38.64 | 101.68 | 0.6395 | -324.0 | -267.1 | |
| 0.00 | 1.15 | 0.00 | 0.73 | -0.96 | 150.38 | -38.76 | 99.79 | 0.6376 | 368.0 | 304.3 | |
| 0.00 | 1.59 | 0.00 | 1.03 | -2.69 | 149.86 | -39.28 | 102.26 | 0.6494 | 594.0 | 455.6 | |
| 1.59 | -17.00 | 1.03 | -17.00 | -0.48 | 149.37 | -39.77 | 98.76 | 0.6495 | -807.4 | 999999 | |
| 25.63 | -17.00 | 16.70 | -17.00 | -1.04 | 149.29 | -39.86 | 99.57 | 0.6521 | -920.1 | 999999 | |
| 1.76 | -17.00 | 1.15 | -17.00 | -1.68 | 149.19 | -39.95 | 100.51 | 0.6551 | -653.2 | 999999 | |
| 0.00 | 1.15 | 0.00 | 0.75 | -1.83 | 148.88 | -40.27 | 100.62 | 0.6596 | -335.0 | -398.8 | |
| 0.00 | 0.70 | 0.00 | 0.47 | -2.06 | 148.59 | -40.55 | 100.87 | 0.6639 | -524.0 | -455.9 | |
| Proj. U | - Projected umbra area in millionths of solar disc, negative values indicate | |
|
that the umbra consists of fragmented regions which cannot be separated without losing umbral area. In this way several spots (intensity minima in the umbra) have a common umbra, e.g. -2 means that the given spot shares an umbra with spot No.2, and the common U value is indicated at spot No.2. |
||
| Proj. WS | - Projected whole spot area in millionths of solar disc, negative values indicate | |
|
that several umbras have a common penumbra, e.g. -7 means that the given umbra shares a penumbra with umbra No.7, and the WS value is indicated at No.7. |
||
| Corr. U | - Corrected umbra area in millionths of solar hemisphere, for negative values see above | |
| Corr. WS | - Corrected whole spot area in millionths of solar hemisphere, for negative values see above | |
| B | - Heliographic latitude B; positive: North, negative: South | |
| L | - Heliographic longitude L | |
| LCM | - Longitudinal distance from the Sun's central meridian | |
| Pos. angle | - Position angle | |
| r | - Distance from the centre of Sun's disc in terms of Sun's radius | |
| MU | - Mean magnetic field within the umbra contour averaged the pixel values with sign. | |
| MP | - Mean magnetic field within the penumbra contour averaged the pixel values with sign. | |