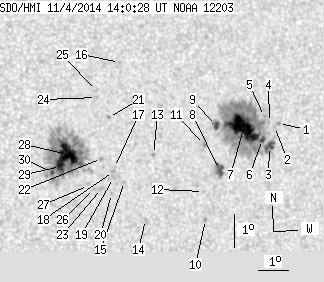
SDO HMI 2014-11-04 14:00:28 UT
See sunspots with tool (Click here to study sunspot positions and configurations with tool using white-light and magnetogram images and polarity drawing)
(It is recommended to set high resolution on your display!)
| group | Proj. U | Proj. WS | Corr. U | Corr. WS | B | L | LCM | Pos. angle | r | MU | MP |
| 83.73 | 395.40 | 46.64 | 219.67 | 12.33 | 114.34 | 25.75 | 289.76 | 0.4520 | -109.8 | -36.7 | |
|
previous
or next observation for the same group /
back to the solar disc SDO HMI 2014-11-04 14:00:28 UT
See sunspots with tool (Click here to study sunspot positions and configurations with tool using white-light and magnetogram images and polarity drawing) (It is recommended to set high resolution on your display!) |
| spot | Proj. U | Proj. WS | Corr. U | Corr. WS | B | L | LCM | Pos. angle | r | MU | MP |
| 0.00 | 1.04 | 0.00 | 0.60 | 12.82 | 118.19 | 29.61 | 288.56 | 0.5102 | -560.0 | -435.2 | |
| 0.00 | 0.69 | 0.00 | 0.40 | 12.73 | 118.04 | 29.46 | 288.47 | 0.5078 | -562.0 | -444.5 | |
| 4.49 | 197.78 | 2.57 | 112.40 | 12.14 | 117.79 | 29.21 | 287.44 | 0.5021 | -770.1 | -440.3 | |
| 0.00 | 1.30 | 0.00 | 0.74 | 12.86 | 117.88 | 29.30 | 288.79 | 0.5060 | -396.0 | -224.7 | |
| 0.00 | 1.04 | 0.00 | 0.59 | 13.05 | 117.73 | 29.15 | 289.22 | 0.5045 | -475.0 | -374.1 | |
| 2.25 | -3.00 | 1.28 | -3.00 | 12.36 | 117.57 | 28.99 | 287.96 | 0.4997 | -787.7 | 999999 | |
| 36.72 | -3.00 | 20.87 | -3.00 | 12.71 | 116.96 | 28.37 | 288.95 | 0.4921 | -1235.5 | 999999 | |
| 4.75 | 9.07 | 2.67 | 5.10 | 11.51 | 115.99 | 27.41 | 287.00 | 0.4736 | -1019.0 | -842.0 | |
| 2.85 | -3.00 | 1.61 | -3.00 | 12.83 | 116.04 | 27.45 | 289.68 | 0.4794 | -1021.2 | 999999 | |
| 0.00 | 1.38 | 0.00 | 0.77 | 10.03 | 115.37 | 26.78 | 284.16 | 0.4596 | -855.0 | -647.8 | |
| 0.00 | 1.81 | 0.00 | 1.02 | 12.28 | 115.56 | 26.98 | 288.80 | 0.4702 | -950.0 | -733.7 | |
| 0.00 | 1.04 | 0.00 | 0.58 | 10.87 | 115.38 | 26.80 | 285.95 | 0.4624 | -770.0 | -619.2 | |
| 0.00 | 1.21 | 0.00 | 0.67 | 12.03 | 113.81 | 25.22 | 289.27 | 0.4434 | 899.0 | 725.3 | |
| 0.00 | 0.95 | 0.00 | 0.52 | 10.09 | 113.36 | 24.78 | 285.19 | 0.4293 | 757.0 | 596.8 | |
| 0.00 | 1.38 | 0.00 | 0.76 | 11.25 | 112.76 | 24.18 | 288.16 | 0.4246 | 577.0 | 484.9 | |
| 0.00 | 0.95 | 0.00 | 0.53 | 14.83 | 112.98 | 24.39 | 295.86 | 0.4455 | -730.0 | -561.3 | |
| 0.00 | 1.38 | 0.00 | 0.75 | 11.68 | 112.47 | 23.89 | 289.32 | 0.4220 | 364.0 | 398.5 | |
| 0.00 | 1.21 | 0.00 | 0.66 | 11.56 | 112.43 | 23.84 | 289.08 | 0.4208 | 813.0 | 623.6 | |
| 0.00 | 1.99 | 0.00 | 1.08 | 11.38 | 112.41 | 23.82 | 288.67 | 0.4198 | 722.0 | 641.0 | |
| 0.00 | 0.95 | 0.00 | 0.52 | 10.90 | 112.30 | 23.72 | 287.63 | 0.4162 | 877.0 | 686.0 | |
| 0.00 | 1.30 | 0.00 | 0.71 | 13.18 | 112.42 | 23.83 | 292.75 | 0.4284 | 729.0 | 610.7 | |
| 0.00 | 1.30 | 0.00 | 0.71 | 11.96 | 112.06 | 23.48 | 290.24 | 0.4172 | 731.0 | 568.2 | |
| 0.00 | 2.25 | 0.00 | 1.22 | 11.06 | 111.98 | 23.40 | 288.20 | 0.4120 | 901.0 | 641.8 | |
| 0.00 | 1.47 | 0.00 | 0.80 | 13.80 | 112.08 | 23.50 | 294.36 | 0.4269 | 658.0 | 603.1 | |
| 0.00 | 1.21 | 0.00 | 0.66 | 14.01 | 112.11 | 23.52 | 294.81 | 0.4284 | 564.0 | 460.6 | |
| 0.00 | 0.95 | 0.00 | 0.52 | 11.07 | 111.75 | 23.17 | 288.36 | 0.4086 | 783.0 | 547.6 | |
| 0.00 | 0.60 | 0.00 | 0.33 | 11.16 | 111.56 | 22.98 | 288.71 | 0.4061 | 575.0 | 552.3 | |
| 25.58 | 161.15 | 13.82 | 87.03 | 12.11 | 110.96 | 22.37 | 291.39 | 0.4014 | 1191.9 | 439.7 | |
| 5.88 | -28.00 | 3.17 | -28.00 | 11.76 | 110.69 | 22.11 | 290.74 | 0.3957 | 1182.0 | 999999 | |
| 1.21 | -28.00 | 0.65 | -28.00 | 11.59 | 110.42 | 21.83 | 290.53 | 0.3907 | 1118.0 | 999999 | |
| Proj. U | - Projected umbra area in millionths of solar disc, negative values indicate | |
|
that the umbra consists of fragmented regions which cannot be separated without losing umbral area. In this way several spots (intensity minima in the umbra) have a common umbra, e.g. -2 means that the given spot shares an umbra with spot No.2, and the common U value is indicated at spot No.2. |
||
| Proj. WS | - Projected whole spot area in millionths of solar disc, negative values indicate | |
|
that several umbras have a common penumbra, e.g. -7 means that the given umbra shares a penumbra with umbra No.7, and the WS value is indicated at No.7. |
||
| Corr. U | - Corrected umbra area in millionths of solar hemisphere, for negative values see above | |
| Corr. WS | - Corrected whole spot area in millionths of solar hemisphere, for negative values see above | |
| B | - Heliographic latitude B; positive: North, negative: South | |
| L | - Heliographic longitude L | |
| LCM | - Longitudinal distance from the Sun's central meridian | |
| Pos. angle | - Position angle | |
| r | - Distance from the centre of Sun's disc in terms of Sun's radius | |
| MU | - Mean magnetic field within the umbra contour averaged the pixel values with sign. | |
| MP | - Mean magnetic field within the penumbra contour averaged the pixel values with sign. | |