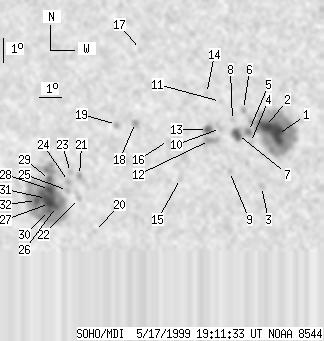
SOHO MDI 1999-05-17 19:11:33 UT
| group | Proj. U | Proj. WS | Corr. U | Corr. WS | B | L | LCM | Pos. angle | r | MU | MP |
| 83 | 621 | 46 | 351 | -19.96 | 119.68 | -22.15 | 131.32 | 0.4684 | -332.4 | -47.3 | |
|
previous
or next observation for the same group /
back to the solar disc SOHO MDI 1999-05-17 19:11:33 UT |
| spot | Proj. U | Proj. WS | Corr. U | Corr. WS | B | L | LCM | Pos. angle | r | MU | MP |
| 21 | 220 | 11 | 118 | -18.86 | 125.35 | -16.48 | 136.65 | 0.3927 | -1941.9 | -807.0 | |
| 14 | -1 | 8 | -1 | -18.53 | 124.87 | -16.96 | 135.23 | 0.3945 | -1703.0 | 999999 | |
| 0 | 6 | 0 | 3 | -21.00 | 124.42 | -17.41 | 138.88 | 0.4266 | -857.0 | -679.3 | |
| 0 | 5 | 0 | 3 | -19.18 | 124.15 | -17.68 | 135.29 | 0.4096 | -307.0 | -202.8 | |
| 3 | 9 | 2 | 5 | -18.72 | 124.11 | -17.72 | 134.40 | 0.4052 | -1341.2 | -876.6 | |
| 0 | 5 | 0 | 2 | -17.82 | 123.99 | -17.84 | 132.49 | 0.3973 | -629.0 | -578.5 | |
| 8 | 19 | 4 | 10 | -18.84 | 123.62 | -18.21 | 133.87 | 0.4121 | -1204.9 | -852.0 | |
| 0 | 3 | 0 | 2 | -18.27 | 123.46 | -18.37 | 132.56 | 0.4080 | -771.0 | -642.4 | |
| 0 | 3 | 0 | 2 | -20.36 | 123.08 | -18.75 | 135.79 | 0.4340 | 596.0 | 406.1 | |
| 0 | 8 | 0 | 5 | -18.59 | 122.90 | -18.93 | 132.35 | 0.4178 | -871.0 | -617.7 | |
| 0 | 4 | 0 | 2 | -17.49 | 123.02 | -18.81 | 130.40 | 0.4055 | -794.0 | -587.5 | |
| 0 | 16 | 0 | 9 | -19.07 | 122.36 | -19.47 | 132.48 | 0.4290 | -906.0 | -756.7 | |
| 5 | 12 | 3 | 7 | -18.62 | 122.33 | -19.51 | 131.60 | 0.4249 | -1087.5 | -741.4 | |
| 0 | 3 | 0 | 2 | -17.15 | 122.45 | -19.38 | 128.94 | 0.4094 | -481.0 | -536.9 | |
| 0 | 3 | 0 | 2 | -20.62 | 120.86 | -20.97 | 133.20 | 0.4614 | -597.0 | -590.7 | |
| 0 | 6 | 0 | 3 | -19.05 | 120.54 | -21.29 | 130.05 | 0.4502 | -689.0 | -560.4 | |
| 0 | 2 | 0 | 1 | -15.33 | 119.76 | -22.07 | 121.96 | 0.4289 | -585.0 | -523.2 | |
| 0 | 7 | 0 | 4 | -18.29 | 119.17 | -22.66 | 127.05 | 0.4603 | 895.0 | 617.3 | |
| 0 | 5 | 0 | 3 | -18.35 | 118.30 | -23.53 | 126.23 | 0.4716 | 1016.0 | 801.3 | |
| 0 | 3 | 0 | 2 | -22.76 | 116.54 | -25.29 | 131.69 | 0.5298 | 684.0 | 535.3 | |
| 0 | 6 | 0 | 4 | -20.42 | 116.27 | -25.56 | 127.71 | 0.5131 | 1175.0 | 864.5 | |
| 0 | 4 | 0 | 2 | -21.37 | 116.05 | -25.78 | 129.03 | 0.5234 | 920.0 | 661.3 | |
| 0 | 5 | 0 | 3 | -20.29 | 115.88 | -25.95 | 127.11 | 0.5167 | 970.0 | 843.7 | |
| 0 | 6 | 0 | 4 | -20.66 | 115.72 | -26.11 | 127.56 | 0.5216 | 1119.0 | 990.2 | |
| 0 | 4 | 0 | 2 | -21.03 | 115.60 | -26.23 | 128.05 | 0.5259 | 657.0 | 669.9 | |
| 4 | 257 | 2 | 151 | -21.68 | 114.95 | -26.88 | 128.47 | 0.5387 | 1382.5 | 602.0 | |
| 5 | -26 | 3 | -26 | -21.55 | 114.65 | -27.18 | 127.99 | 0.5412 | 1513.3 | 999999 | |
| 8 | -26 | 4 | -26 | -20.97 | 114.76 | -27.07 | 127.17 | 0.5353 | 1662.3 | 999999 | |
| 4 | -26 | 2 | -26 | -20.56 | 114.84 | -26.99 | 126.58 | 0.5312 | 1303.5 | 999999 | |
| 3 | -26 | 2 | -26 | -21.84 | 114.59 | -27.24 | 128.39 | 0.5442 | 785.7 | 999999 | |
| 3 | -26 | 2 | -26 | -21.34 | 114.55 | -27.28 | 127.56 | 0.5407 | 1523.6 | 999999 | |
| 5 | -26 | 3 | -26 | -21.42 | 114.06 | -27.77 | 127.24 | 0.5470 | 696.2 | 999999 | |
| Proj. U | - Projected umbra area in millionths of solar disc, negative values indicate | |
|
that the umbra consists of fragmented regions which cannot be separated without losing umbral area. In this way several spots (intensity minima in the umbra) have a common umbra, e.g. -2 means that the given spot shares an umbra with spot No.2, and the common U value is indicated at spot No.2. |
||
| Proj. WS | - Projected whole spot area in millionths of solar disc, negative values indicate | |
|
that several umbras have a common penumbra, e.g. -7 means that the given umbra shares a penumbra with umbra No.7, and the WS value is indicated at No.7. |
||
| Corr. U | - Corrected umbra area in millionths of solar hemisphere, for negative values see above | |
| Corr. WS | - Corrected whole spot area in millionths of solar hemisphere, for negative values see above | |
| B | - Heliographic latitude B; positive: North, negative: South | |
| L | - Heliographic longitude L | |
| LCM | - Longitudinal distance from the Sun's central meridian | |
| Pos. angle | - Position angle | |
| r | - Distance from the centre of Sun's disc in terms of Sun's radius | |
| MU | - Mean magnetic field within the umbra contour averaged the pixel values with sign. | |
| MP | - Mean magnetic field within the penumbra contour averaged the pixel values with sign. | |