SOHO MDI 1999-05-17 23:59:33 UT
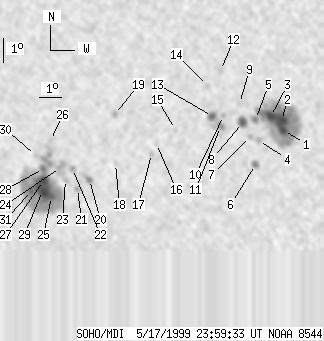
| group | Proj. U | Proj. WS | Corr. U | Corr. WS | B | L | LCM | Pos. angle | r | MU | MP |
| 87 | 611 | 50 | 339 | -20.06 | 119.38 | -19.81 | 134.75 | 0.4433 | -169.7 | 34.9 | |
|
previous
or next observation for the same group /
back to the solar disc SOHO MDI 1999-05-17 23:59:33 UT |
| spot | Proj. U | Proj. WS | Corr. U | Corr. WS | B | L | LCM | Pos. angle | r | MU | MP |
| 6 | 206 | 3 | 110 | -19.12 | 125.52 | -13.66 | 142.27 | 0.3663 | -1459.0 | -828.2 | |
| 15 | -1 | 8 | -1 | -18.71 | 125.47 | -13.71 | 141.43 | 0.3617 | -2102.6 | 999999 | |
| 11 | -1 | 6 | -1 | -18.54 | 125.02 | -14.17 | 140.23 | 0.3644 | -1800.1 | 999999 | |
| 0 | 5 | 0 | 2 | -19.52 | 124.41 | -14.77 | 140.86 | 0.3824 | -571.0 | -473.8 | |
| 3 | 5 | 2 | 3 | -18.65 | 124.37 | -14.82 | 139.21 | 0.3726 | -1040.6 | -956.1 | |
| 3 | 9 | 2 | 5 | -20.50 | 124.19 | -15.00 | 142.14 | 0.3966 | 819.6 | 603.9 | |
| 0 | 3 | 0 | 2 | -19.35 | 124.09 | -15.10 | 139.97 | 0.3838 | -783.0 | -620.8 | |
| 7 | 16 | 4 | 9 | -18.77 | 123.80 | -15.39 | 138.40 | 0.3801 | -1201.2 | -783.4 | |
| 0 | 3 | 0 | 2 | -17.99 | 123.74 | -15.45 | 136.82 | 0.3718 | -871.0 | -797.4 | |
| 0 | 3 | 0 | 2 | -18.48 | 123.00 | -16.18 | 136.46 | 0.3854 | -1100.0 | -955.6 | |
| 0 | 13 | 0 | 7 | -18.92 | 122.83 | -16.36 | 137.01 | 0.3923 | -1095.0 | -866.8 | |
| 0 | 3 | 0 | 1 | -16.64 | 123.04 | -16.14 | 132.88 | 0.3651 | -909.0 | -686.4 | |
| 5 | 11 | 3 | 6 | -18.51 | 122.53 | -16.66 | 135.73 | 0.3911 | -1171.4 | -873.1 | |
| 0 | 3 | 0 | 2 | -17.25 | 122.43 | -16.75 | 133.10 | 0.3787 | -829.0 | -646.3 | |
| 0 | 3 | 0 | 2 | -19.02 | 120.86 | -18.33 | 134.07 | 0.4155 | -770.0 | -591.2 | |
| 0 | 4 | 0 | 2 | -19.59 | 119.96 | -19.23 | 133.79 | 0.4316 | -284.0 | -344.2 | |
| 0 | 4 | 0 | 2 | -20.00 | 119.68 | -19.50 | 134.12 | 0.4389 | -471.0 | -296.5 | |
| 0 | 4 | 0 | 2 | -20.39 | 118.02 | -21.16 | 132.60 | 0.4616 | -689.0 | -525.3 | |
| 0 | 6 | 0 | 3 | -18.37 | 118.25 | -20.94 | 129.30 | 0.4400 | 865.0 | 680.0 | |
| 2 | 13 | 1 | 7 | -21.03 | 116.75 | -22.44 | 132.12 | 0.4823 | 1147.3 | 970.3 | |
| 0 | 3 | 0 | 2 | -21.40 | 116.14 | -23.05 | 132.01 | 0.4926 | 909.0 | 667.4 | |
| 0 | 6 | 0 | 3 | -20.56 | 116.05 | -23.14 | 130.53 | 0.4861 | 1010.0 | 889.7 | |
| 0 | 5 | 0 | 3 | -21.01 | 115.65 | -23.54 | 130.84 | 0.4947 | 900.0 | 757.0 | |
| 0 | 19 | 0 | 11 | -20.51 | 115.51 | -23.68 | 129.84 | 0.4920 | 1291.0 | 1090.0 | |
| 4 | 259 | 3 | 149 | -21.71 | 114.88 | -24.30 | 131.12 | 0.5096 | 1392.2 | 631.8 | |
| 0 | 2 | 0 | 1 | -19.39 | 115.23 | -23.96 | 127.64 | 0.4857 | 1060.0 | 811.8 | |
| 9 | -25 | 5 | -25 | -21.04 | 114.63 | -24.55 | 129.77 | 0.5067 | 1805.0 | 999999 | |
| 3 | -25 | 2 | -25 | -20.54 | 114.72 | -24.47 | 129.05 | 0.5014 | 1291.3 | 999999 | |
| 14 | -25 | 8 | -25 | -21.45 | 114.51 | -24.68 | 130.32 | 0.5116 | 1449.4 | 999999 | |
| 0 | 3 | 0 | 1 | -20.00 | 114.44 | -24.75 | 127.85 | 0.5002 | 704.0 | 685.7 | |
| 5 | -25 | 3 | -25 | -21.44 | 114.00 | -25.19 | 129.77 | 0.5174 | 775.0 | 999999 | |
| Proj. U | - Projected umbra area in millionths of solar disc, negative values indicate | |
|
that the umbra consists of fragmented regions which cannot be separated without losing umbral area. In this way several spots (intensity minima in the umbra) have a common umbra, e.g. -2 means that the given spot shares an umbra with spot No.2, and the common U value is indicated at spot No.2. |
||
| Proj. WS | - Projected whole spot area in millionths of solar disc, negative values indicate | |
|
that several umbras have a common penumbra, e.g. -7 means that the given umbra shares a penumbra with umbra No.7, and the WS value is indicated at No.7. |
||
| Corr. U | - Corrected umbra area in millionths of solar hemisphere, for negative values see above | |
| Corr. WS | - Corrected whole spot area in millionths of solar hemisphere, for negative values see above | |
| B | - Heliographic latitude B; positive: North, negative: South | |
| L | - Heliographic longitude L | |
| LCM | - Longitudinal distance from the Sun's central meridian | |
| Pos. angle | - Position angle | |
| r | - Distance from the centre of Sun's disc in terms of Sun's radius | |
| MU | - Mean magnetic field within the umbra contour averaged the pixel values with sign. | |
| MP | - Mean magnetic field within the penumbra contour averaged the pixel values with sign. | |