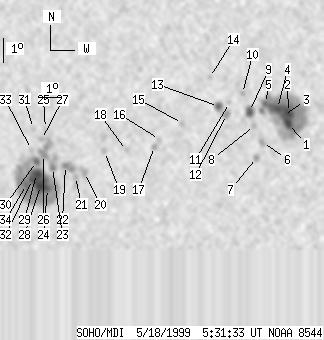
SOHO MDI 1999-05-18 05:31:33 UT
| group | Proj. U | Proj. WS | Corr. U | Corr. WS | B | L | LCM | Pos. angle | r | MU | MP |
| 77 | 636 | 43 | 348 | -19.99 | 119.41 | -16.73 | 139.62 | 0.4104 | 84.2 | 1.6 | |
|
previous
or next observation for the same group /
back to the solar disc SOHO MDI 1999-05-18 05:31:33 UT |
| spot | Proj. U | Proj. WS | Corr. U | Corr. WS | B | L | LCM | Pos. angle | r | MU | MP |
| 5 | 233 | 3 | 122 | -19.12 | 125.67 | -10.47 | 149.24 | 0.3372 | -1472.2 | -830.5 | |
| 8 | -1 | 4 | -1 | -18.67 | 125.70 | -10.44 | 148.57 | 0.3307 | -2227.7 | 999999 | |
| 1 | -1 | 0 | -1 | -18.79 | 125.48 | -10.66 | 148.25 | 0.3343 | -1824.0 | 999999 | |
| 6 | -1 | 3 | -1 | -18.50 | 125.24 | -10.90 | 147.21 | 0.3324 | -2001.1 | 999999 | |
| 3 | -1 | 2 | -1 | -18.30 | 124.75 | -11.39 | 145.70 | 0.3341 | -1377.9 | 999999 | |
| 0 | 6 | 0 | 3 | -19.89 | 124.51 | -11.63 | 147.85 | 0.3577 | -570.0 | -460.1 | |
| 0 | 4 | 0 | 2 | -20.51 | 124.21 | -11.93 | 148.16 | 0.3687 | 835.0 | 737.0 | |
| 0 | 3 | 0 | 2 | -19.19 | 124.22 | -11.92 | 146.07 | 0.3509 | -746.0 | -715.2 | |
| 7 | 17 | 4 | 9 | -18.62 | 124.05 | -12.09 | 144.70 | 0.3450 | -1172.2 | -746.1 | |
| 0 | 4 | 0 | 2 | -17.88 | 123.81 | -12.33 | 142.82 | 0.3378 | -1119.0 | -921.3 | |
| 0 | 3 | 0 | 2 | -18.24 | 123.23 | -12.91 | 142.26 | 0.3482 | -877.0 | -715.4 | |
| 0 | 6 | 0 | 3 | -18.73 | 123.06 | -13.07 | 142.81 | 0.3560 | -1225.0 | -998.2 | |
| 5 | 10 | 2 | 6 | -18.40 | 122.75 | -13.39 | 141.56 | 0.3550 | -1217.4 | -889.6 | |
| 0 | 3 | 0 | 2 | -17.22 | 122.46 | -13.68 | 138.68 | 0.3437 | -896.0 | -600.4 | |
| 0 | 4 | 0 | 2 | -19.08 | 121.15 | -14.99 | 139.73 | 0.3798 | -626.0 | -636.9 | |
| 0 | 4 | 0 | 2 | -19.73 | 120.09 | -16.05 | 139.02 | 0.3985 | -426.0 | -336.1 | |
| 0 | 5 | 0 | 3 | -20.01 | 119.84 | -16.29 | 139.10 | 0.4044 | -685.0 | -504.0 | |
| 0 | 3 | 0 | 2 | -20.17 | 118.60 | -17.54 | 137.35 | 0.4193 | 606.0 | 645.7 | |
| 0 | 5 | 0 | 3 | -20.19 | 117.63 | -18.51 | 135.93 | 0.4302 | -492.0 | -370.6 | |
| 0 | 7 | 0 | 4 | -21.05 | 116.63 | -19.51 | 135.95 | 0.4501 | 1305.0 | 1018.0 | |
| 0 | 12 | 0 | 6 | -21.21 | 116.20 | -19.93 | 135.63 | 0.4564 | 1030.0 | 745.4 | |
| 2 | 15 | 1 | 8 | -20.75 | 115.82 | -20.32 | 134.35 | 0.4560 | 1296.8 | 1005.7 | |
| 2 | 21 | 1 | 12 | -20.82 | 115.23 | -20.91 | 133.70 | 0.4634 | 1206.2 | 1081.1 | |
| 4 | 235 | 2 | 132 | -21.69 | 114.87 | -21.27 | 134.67 | 0.4759 | 1462.4 | 568.5 | |
| 0 | 3 | 0 | 2 | -19.21 | 115.14 | -21.00 | 130.79 | 0.4489 | 962.0 | 821.6 | |
| 0 | 21 | 0 | 12 | -20.28 | 114.90 | -21.24 | 132.36 | 0.4618 | 1377.0 | 1129.5 | |
| 0 | 4 | 0 | 2 | -19.66 | 114.90 | -21.24 | 131.28 | 0.4559 | 895.0 | 806.6 | |
| 10 | -24 | 6 | -24 | -21.56 | 114.57 | -21.57 | 134.09 | 0.4779 | 1548.6 | 999999 | |
| 10 | -24 | 6 | -24 | -21.06 | 114.47 | -21.67 | 133.14 | 0.4742 | 1751.8 | 999999 | |
| 3 | -24 | 2 | -24 | -20.57 | 114.54 | -21.60 | 132.40 | 0.4686 | 1312.4 | 999999 | |
| 0 | 5 | 0 | 3 | -19.21 | 114.60 | -21.54 | 130.11 | 0.4551 | 826.0 | 690.4 | |
| 6 | -24 | 4 | -24 | -21.31 | 114.25 | -21.89 | 133.27 | 0.4790 | 1284.7 | 999999 | |
| 0 | 3 | 0 | 2 | -20.07 | 114.39 | -21.75 | 131.36 | 0.4656 | 855.0 | 720.8 | |
| 5 | -24 | 3 | -24 | -21.51 | 113.94 | -22.20 | 133.23 | 0.4844 | 771.7 | 999999 | |
| Proj. U | - Projected umbra area in millionths of solar disc, negative values indicate | |
|
that the umbra consists of fragmented regions which cannot be separated without losing umbral area. In this way several spots (intensity minima in the umbra) have a common umbra, e.g. -2 means that the given spot shares an umbra with spot No.2, and the common U value is indicated at spot No.2. |
||
| Proj. WS | - Projected whole spot area in millionths of solar disc, negative values indicate | |
|
that several umbras have a common penumbra, e.g. -7 means that the given umbra shares a penumbra with umbra No.7, and the WS value is indicated at No.7. |
||
| Corr. U | - Corrected umbra area in millionths of solar hemisphere, for negative values see above | |
| Corr. WS | - Corrected whole spot area in millionths of solar hemisphere, for negative values see above | |
| B | - Heliographic latitude B; positive: North, negative: South | |
| L | - Heliographic longitude L | |
| LCM | - Longitudinal distance from the Sun's central meridian | |
| Pos. angle | - Position angle | |
| r | - Distance from the centre of Sun's disc in terms of Sun's radius | |
| MU | - Mean magnetic field within the umbra contour averaged the pixel values with sign. | |
| MP | - Mean magnetic field within the penumbra contour averaged the pixel values with sign. | |