SOHO MDI 1999-05-18 07:59:33 UT
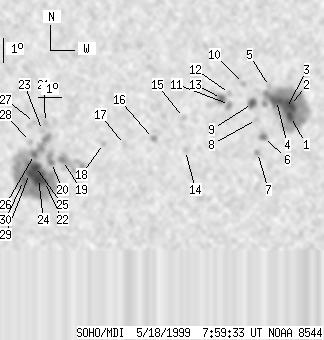
| group | Proj. U | Proj. WS | Corr. U | Corr. WS | B | L | LCM | Pos. angle | r | MU | MP |
| 91 | 634 | 48 | 344 | -20.12 | 119.16 | -15.62 | 141.86 | 0.4009 | 36.9 | 37.3 | |
|
previous
or next observation for the same group /
back to the solar disc SOHO MDI 1999-05-18 07:59:33 UT |
| spot | Proj. U | Proj. WS | Corr. U | Corr. WS | B | L | LCM | Pos. angle | r | MU | MP |
| 6 | 207 | 3 | 108 | -19.12 | 125.74 | -9.04 | 152.77 | 0.3259 | -1520.0 | -862.5 | |
| 8 | -1 | 4 | -1 | -18.67 | 125.76 | -9.02 | 152.14 | 0.3192 | -2160.0 | 999999 | |
| 1 | -1 | 0 | -1 | -18.79 | 125.59 | -9.19 | 151.88 | 0.3223 | -1901.0 | 999999 | |
| 12 | -1 | 6 | -1 | -18.46 | 125.19 | -9.59 | 150.33 | 0.3208 | -1710.4 | 999999 | |
| 0 | 5 | 0 | 3 | -17.89 | 124.93 | -9.85 | 148.70 | 0.3149 | -1114.0 | -737.5 | |
| 3 | 9 | 1 | 5 | -19.97 | 124.55 | -10.23 | 151.13 | 0.3474 | -846.6 | -690.7 | |
| 0 | 5 | 0 | 2 | -20.59 | 124.25 | -10.53 | 151.35 | 0.3584 | 1067.0 | 725.3 | |
| 0 | 3 | 0 | 2 | -19.23 | 124.30 | -10.48 | 149.41 | 0.3390 | -862.0 | -638.9 | |
| 6 | 14 | 3 | 8 | -18.57 | 124.17 | -10.61 | 148.02 | 0.3310 | -1290.4 | -740.9 | |
| 0 | 4 | 0 | 2 | -17.75 | 123.84 | -10.94 | 145.80 | 0.3229 | -1016.0 | -829.3 | |
| 0 | 8 | 0 | 4 | -18.61 | 123.20 | -11.58 | 145.82 | 0.3403 | -1310.0 | -861.9 | |
| 0 | 4 | 0 | 2 | -18.16 | 123.23 | -11.55 | 145.09 | 0.3340 | -922.0 | -741.3 | |
| 5 | 13 | 3 | 7 | -18.36 | 122.88 | -11.91 | 144.66 | 0.3400 | -1214.5 | -891.2 | |
| 0 | 4 | 0 | 2 | -20.48 | 121.17 | -13.61 | 144.74 | 0.3836 | -802.0 | -726.4 | |
| 0 | 3 | 0 | 2 | -19.12 | 121.20 | -13.58 | 142.51 | 0.3661 | -739.0 | -571.4 | |
| 0 | 5 | 0 | 3 | -19.97 | 119.83 | -14.95 | 141.39 | 0.3902 | -719.0 | -556.4 | |
| 0 | 3 | 0 | 2 | -20.21 | 118.55 | -16.23 | 139.55 | 0.4061 | 523.0 | 476.7 | |
| 0 | 4 | 0 | 2 | -20.16 | 117.63 | -17.15 | 137.97 | 0.4151 | -694.0 | -486.7 | |
| 2 | 47 | 1 | 26 | -20.84 | 115.74 | -19.04 | 136.27 | 0.4429 | 1248.4 | 864.0 | |
| 3 | 15 | 2 | 8 | -20.91 | 115.24 | -19.54 | 135.70 | 0.4492 | 1167.1 | 1147.0 | |
| 0 | 4 | 0 | 2 | -19.26 | 115.19 | -19.59 | 132.76 | 0.4329 | 1213.0 | 1080.0 | |
| 5 | 263 | 3 | 147 | -21.70 | 114.82 | -19.96 | 136.40 | 0.4619 | 1502.3 | 622.2 | |
| 0 | 2 | 0 | 1 | -19.59 | 115.02 | -19.77 | 133.10 | 0.4382 | 947.0 | 928.6 | |
| 13 | -22 | 8 | -22 | -21.57 | 114.56 | -20.22 | 135.85 | 0.4633 | 1574.1 | 999999 | |
| 10 | -22 | 5 | -22 | -21.07 | 114.50 | -20.28 | 134.95 | 0.4589 | 1794.7 | 999999 | |
| 3 | -22 | 2 | -22 | -20.57 | 114.53 | -20.25 | 134.15 | 0.4536 | 1221.1 | 999999 | |
| 0 | 8 | 0 | 4 | -19.25 | 114.70 | -20.08 | 132.08 | 0.4385 | 947.0 | 699.9 | |
| 0 | 4 | 0 | 2 | -20.03 | 114.42 | -20.36 | 133.09 | 0.4494 | 621.0 | 566.8 | |
| 8 | -22 | 4 | -22 | -21.36 | 114.19 | -20.59 | 135.01 | 0.4652 | 1276.4 | 999999 | |
| 6 | -22 | 3 | -22 | -21.64 | 113.88 | -20.90 | 135.07 | 0.4715 | 581.2 | 999999 | |
| Proj. U | - Projected umbra area in millionths of solar disc, negative values indicate | |
|
that the umbra consists of fragmented regions which cannot be separated without losing umbral area. In this way several spots (intensity minima in the umbra) have a common umbra, e.g. -2 means that the given spot shares an umbra with spot No.2, and the common U value is indicated at spot No.2. |
||
| Proj. WS | - Projected whole spot area in millionths of solar disc, negative values indicate | |
|
that several umbras have a common penumbra, e.g. -7 means that the given umbra shares a penumbra with umbra No.7, and the WS value is indicated at No.7. |
||
| Corr. U | - Corrected umbra area in millionths of solar hemisphere, for negative values see above | |
| Corr. WS | - Corrected whole spot area in millionths of solar hemisphere, for negative values see above | |
| B | - Heliographic latitude B; positive: North, negative: South | |
| L | - Heliographic longitude L | |
| LCM | - Longitudinal distance from the Sun's central meridian | |
| Pos. angle | - Position angle | |
| r | - Distance from the centre of Sun's disc in terms of Sun's radius | |
| MU | - Mean magnetic field within the umbra contour averaged the pixel values with sign. | |
| MP | - Mean magnetic field within the penumbra contour averaged the pixel values with sign. | |