SOHO MDI 1999-05-18 11:11:33 UT
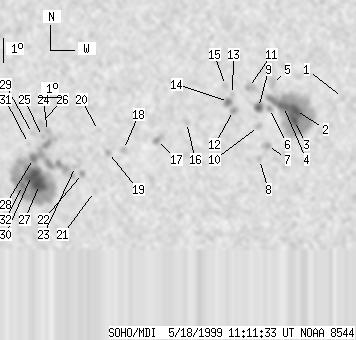
| group | Proj. U | Proj. WS | Corr. U | Corr. WS | B | L | LCM | Pos. angle | r | MU | MP |
| 79 | 677 | 44 | 364 | -20.08 | 119.20 | -13.82 | 145.36 | 0.3838 | 77.6 | 53.2 | |
|
previous
or next observation for the same group /
back to the solar disc SOHO MDI 1999-05-18 11:11:33 UT |
| spot | Proj. U | Proj. WS | Corr. U | Corr. WS | B | L | LCM | Pos. angle | r | MU | MP |
| 0 | 3 | 0 | 1 | -18.14 | 127.83 | -5.19 | 162.46 | 0.2866 | -922.0 | -757.9 | |
| 12 | 204 | 6 | 106 | -18.66 | 125.85 | -7.17 | 157.18 | 0.3062 | -2108.5 | -805.1 | |
| 4 | -2 | 2 | -2 | -19.07 | 125.79 | -7.23 | 157.55 | 0.3128 | -1552.4 | 999999 | |
| 9 | -2 | 5 | -2 | -18.50 | 125.36 | -7.66 | 155.56 | 0.3070 | -1838.7 | 999999 | |
| 0 | 13 | 0 | 7 | -17.60 | 124.94 | -8.08 | 153.01 | 0.2966 | -1023.0 | -491.1 | |
| 0 | 5 | 0 | 3 | -18.58 | 124.77 | -8.25 | 154.05 | 0.3123 | -948.0 | -756.9 | |
| 0 | 8 | 0 | 4 | -20.10 | 124.60 | -8.41 | 155.74 | 0.3360 | -965.0 | -593.2 | |
| 0 | 4 | 0 | 2 | -20.67 | 124.23 | -8.79 | 155.57 | 0.3470 | 605.0 | 514.3 | |
| 6 | 15 | 3 | 8 | -18.53 | 124.31 | -8.71 | 152.76 | 0.3151 | -1229.3 | -826.5 | |
| 0 | 5 | 0 | 3 | -19.31 | 124.27 | -8.75 | 153.81 | 0.3268 | -766.0 | -525.7 | |
| 0 | 11 | 0 | 6 | -17.71 | 123.93 | -9.09 | 150.43 | 0.3063 | -1055.0 | -883.3 | |
| 0 | 7 | 0 | 4 | -18.65 | 123.25 | -9.77 | 150.23 | 0.3251 | -1109.0 | -837.5 | |
| 0 | 3 | 0 | 1 | -17.99 | 123.25 | -9.77 | 149.13 | 0.3160 | -1003.0 | -813.6 | |
| 3 | 12 | 2 | 6 | -18.28 | 123.06 | -9.96 | 149.15 | 0.3215 | -1284.2 | -905.4 | |
| 0 | 5 | 0 | 2 | -17.63 | 122.97 | -10.04 | 147.79 | 0.3132 | -851.0 | -701.0 | |
| 0 | 6 | 0 | 3 | -19.13 | 121.23 | -11.79 | 146.29 | 0.3492 | -584.0 | -422.4 | |
| 0 | 10 | 0 | 5 | -19.85 | 119.89 | -13.12 | 144.70 | 0.3711 | -1049.0 | -695.4 | |
| 0 | 5 | 0 | 3 | -20.21 | 118.44 | -14.58 | 142.49 | 0.3896 | 883.0 | 710.9 | |
| 0 | 4 | 0 | 2 | -20.33 | 117.78 | -15.24 | 141.49 | 0.3976 | -333.0 | -476.4 | |
| 0 | 3 | 0 | 2 | -19.42 | 117.44 | -15.58 | 139.32 | 0.3903 | 413.0 | 339.5 | |
| 0 | 4 | 0 | 2 | -21.94 | 116.99 | -16.03 | 142.73 | 0.4247 | 806.0 | 604.6 | |
| 0 | 6 | 0 | 4 | -21.19 | 116.55 | -16.47 | 140.81 | 0.4201 | 912.0 | 758.5 | |
| 0 | 3 | 0 | 1 | -20.89 | 116.28 | -16.74 | 139.88 | 0.4195 | 742.0 | 701.6 | |
| 0 | 5 | 0 | 3 | -19.44 | 115.21 | -17.80 | 135.70 | 0.4146 | 1160.0 | 1114.6 | |
| 0 | 2 | 0 | 1 | -19.64 | 114.97 | -18.05 | 135.69 | 0.4194 | 1154.0 | 1039.5 | |
| 0 | 9 | 0 | 5 | -19.06 | 114.99 | -18.02 | 134.69 | 0.4131 | 926.0 | 808.1 | |
| 21 | 319 | 12 | 176 | -21.62 | 114.59 | -18.43 | 138.47 | 0.4451 | 1503.3 | 713.9 | |
| 3 | -27 | 2 | -27 | -20.54 | 114.47 | -18.55 | 136.50 | 0.4346 | 1245.7 | 999999 | |
| 0 | 3 | 0 | 2 | -19.51 | 114.55 | -18.47 | 134.82 | 0.4228 | 796.0 | 871.7 | |
| 18 | -27 | 10 | -27 | -21.24 | 114.29 | -18.73 | 137.41 | 0.4441 | 1646.5 | 999999 | |
| 0 | 3 | 0 | 2 | -19.92 | 114.32 | -18.70 | 135.22 | 0.4296 | 214.0 | 398.5 | |
| 3 | -27 | 2 | -27 | -21.65 | 113.83 | -19.19 | 137.42 | 0.4534 | 703.9 | 999999 | |
| Proj. U | - Projected umbra area in millionths of solar disc, negative values indicate | |
|
that the umbra consists of fragmented regions which cannot be separated without losing umbral area. In this way several spots (intensity minima in the umbra) have a common umbra, e.g. -2 means that the given spot shares an umbra with spot No.2, and the common U value is indicated at spot No.2. |
||
| Proj. WS | - Projected whole spot area in millionths of solar disc, negative values indicate | |
|
that several umbras have a common penumbra, e.g. -7 means that the given umbra shares a penumbra with umbra No.7, and the WS value is indicated at No.7. |
||
| Corr. U | - Corrected umbra area in millionths of solar hemisphere, for negative values see above | |
| Corr. WS | - Corrected whole spot area in millionths of solar hemisphere, for negative values see above | |
| B | - Heliographic latitude B; positive: North, negative: South | |
| L | - Heliographic longitude L | |
| LCM | - Longitudinal distance from the Sun's central meridian | |
| Pos. angle | - Position angle | |
| r | - Distance from the centre of Sun's disc in terms of Sun's radius | |
| MU | - Mean magnetic field within the umbra contour averaged the pixel values with sign. | |
| MP | - Mean magnetic field within the penumbra contour averaged the pixel values with sign. | |