SOHO MDI 1999-05-18 17:35:33 UT
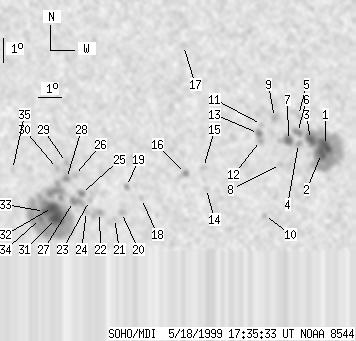
| group | Proj. U | Proj. WS | Corr. U | Corr. WS | B | L | LCM | Pos. angle | r | MU | MP |
| 94 | 630 | 49 | 335 | -20.18 | 118.98 | -10.52 | 152.81 | 0.3588 | -65.2 | 99.4 | |
|
previous
or next observation for the same group /
back to the solar disc SOHO MDI 1999-05-18 17:35:33 UT |
| spot | Proj. U | Proj. WS | Corr. U | Corr. WS | B | L | LCM | Pos. angle | r | MU | MP |
| 13 | 177 | 7 | 92 | -18.69 | 126.11 | -3.38 | 168.78 | 0.2884 | -1973.3 | -725.6 | |
| 12 | -1 | 6 | -1 | -19.01 | 125.94 | -3.55 | 168.46 | 0.2944 | -1559.5 | 999999 | |
| 10 | -1 | 5 | -1 | -18.44 | 125.49 | -4.00 | 166.59 | 0.2866 | -1719.2 | 999999 | |
| 0 | 5 | 0 | 2 | -18.60 | 124.99 | -4.50 | 165.13 | 0.2913 | -1040.0 | -843.3 | |
| 0 | 9 | 0 | 5 | -17.46 | 125.02 | -4.47 | 164.09 | 0.2727 | -1055.0 | -763.8 | |
| 3 | 8 | 2 | 4 | -18.15 | 124.96 | -4.53 | 164.61 | 0.2841 | -1427.7 | -1236.3 | |
| 6 | 21 | 3 | 11 | -18.48 | 124.58 | -4.91 | 163.72 | 0.2911 | -1342.6 | -858.0 | |
| 0 | 4 | 0 | 2 | -19.46 | 124.21 | -5.28 | 163.60 | 0.3085 | -728.0 | -608.4 | |
| 0 | 8 | 0 | 4 | -17.54 | 124.03 | -5.47 | 160.91 | 0.2790 | -1171.0 | -926.7 | |
| 0 | 4 | 0 | 2 | -21.57 | 123.46 | -6.03 | 163.49 | 0.3453 | -842.0 | -658.8 | |
| 0 | 4 | 0 | 2 | -17.82 | 123.48 | -6.02 | 159.53 | 0.2865 | -975.0 | -758.6 | |
| 0 | 2 | 0 | 1 | -18.47 | 123.41 | -6.08 | 160.15 | 0.2971 | -1128.0 | -1022.7 | |
| 3 | 7 | 1 | 4 | -18.19 | 123.34 | -6.15 | 159.57 | 0.2931 | -1242.3 | -994.8 | |
| 0 | 3 | 0 | 2 | -20.44 | 121.06 | -8.44 | 156.16 | 0.3417 | -592.0 | -576.1 | |
| 0 | 5 | 0 | 3 | -19.57 | 120.98 | -8.52 | 154.81 | 0.3294 | -940.0 | -733.0 | |
| 0 | 6 | 0 | 3 | -19.81 | 120.20 | -9.29 | 153.21 | 0.3385 | -1314.0 | -932.8 | |
| 0 | 2 | 0 | 1 | -14.61 | 120.38 | -9.11 | 144.27 | 0.2636 | -385.0 | -253.7 | |
| 0 | 4 | 0 | 2 | -20.83 | 118.26 | -11.23 | 150.21 | 0.3680 | -526.0 | -322.8 | |
| 0 | 6 | 0 | 3 | -20.33 | 117.66 | -11.84 | 148.16 | 0.3662 | -623.0 | -408.1 | |
| 0 | 5 | 0 | 3 | -21.41 | 117.35 | -12.14 | 149.14 | 0.3833 | 121.0 | -1.3 | |
| 0 | 2 | 0 | 1 | -21.65 | 117.03 | -12.46 | 148.84 | 0.3894 | 812.0 | 714.2 | |
| 0 | 10 | 0 | 6 | -21.40 | 116.40 | -13.09 | 147.23 | 0.3913 | 1185.0 | 791.0 | |
| 0 | 3 | 0 | 2 | -20.90 | 116.02 | -13.48 | 145.72 | 0.3882 | 881.0 | 826.4 | |
| 0 | 3 | 0 | 2 | -21.35 | 115.84 | -13.65 | 146.09 | 0.3957 | 875.0 | 781.4 | |
| 3 | 6 | 1 | 3 | -20.60 | 115.70 | -13.80 | 144.64 | 0.3874 | 1248.1 | 1167.3 | |
| 0 | 4 | 0 | 2 | -19.86 | 115.46 | -14.03 | 142.97 | 0.3803 | 1001.0 | 926.5 | |
| 4 | 14 | 2 | 7 | -20.93 | 115.32 | -14.17 | 144.45 | 0.3951 | 1466.2 | 1165.8 | |
| 2 | 10 | 1 | 5 | -19.98 | 115.11 | -14.39 | 142.50 | 0.3852 | 1395.5 | 1182.7 | |
| 0 | 8 | 0 | 4 | -19.32 | 115.17 | -14.33 | 141.48 | 0.3766 | 1131.0 | 903.1 | |
| 0 | 4 | 0 | 2 | -19.56 | 114.76 | -14.74 | 141.14 | 0.3837 | 955.0 | 849.7 | |
| 17 | 282 | 9 | 153 | -21.63 | 114.51 | -14.99 | 144.07 | 0.4114 | 1605.9 | 655.0 | |
| 13 | -31 | 7 | -31 | -21.17 | 114.38 | -15.11 | 143.13 | 0.4070 | 1886.3 | 999999 | |
| 5 | -31 | 3 | -31 | -21.33 | 114.01 | -15.48 | 142.75 | 0.4125 | 1269.3 | 999999 | |
| 3 | -31 | 2 | -31 | -21.62 | 113.81 | -15.69 | 142.85 | 0.4180 | 955.7 | 999999 | |
| 0 | 4 | 0 | 2 | -19.58 | 112.80 | -16.69 | 137.78 | 0.4043 | 672.0 | 419.0 | |
| Proj. U | - Projected umbra area in millionths of solar disc, negative values indicate | |
|
that the umbra consists of fragmented regions which cannot be separated without losing umbral area. In this way several spots (intensity minima in the umbra) have a common umbra, e.g. -2 means that the given spot shares an umbra with spot No.2, and the common U value is indicated at spot No.2. |
||
| Proj. WS | - Projected whole spot area in millionths of solar disc, negative values indicate | |
|
that several umbras have a common penumbra, e.g. -7 means that the given umbra shares a penumbra with umbra No.7, and the WS value is indicated at No.7. |
||
| Corr. U | - Corrected umbra area in millionths of solar hemisphere, for negative values see above | |
| Corr. WS | - Corrected whole spot area in millionths of solar hemisphere, for negative values see above | |
| B | - Heliographic latitude B; positive: North, negative: South | |
| L | - Heliographic longitude L | |
| LCM | - Longitudinal distance from the Sun's central meridian | |
| Pos. angle | - Position angle | |
| r | - Distance from the centre of Sun's disc in terms of Sun's radius | |
| MU | - Mean magnetic field within the umbra contour averaged the pixel values with sign. | |
| MP | - Mean magnetic field within the penumbra contour averaged the pixel values with sign. | |