SOHO MDI 1999-05-18 18:31:33 UT
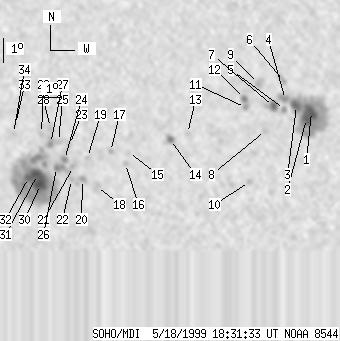
| group | Proj. U | Proj. WS | Corr. U | Corr. WS | B | L | LCM | Pos. angle | r | MU | MP |
| 86 | 666 | 47 | 353 | -20.20 | 118.94 | -10.04 | 153.97 | 0.3559 | -62.5 | 148.6 | |
|
previous
or next observation for the same group /
back to the solar disc SOHO MDI 1999-05-18 18:31:33 UT |
| spot | Proj. U | Proj. WS | Corr. U | Corr. WS | B | L | LCM | Pos. angle | r | MU | MP |
| 13 | 202 | 7 | 104 | -18.69 | 126.18 | -2.80 | 170.67 | 0.2867 | -1972.7 | -738.5 | |
| 11 | -1 | 6 | -1 | -18.97 | 125.97 | -3.01 | 170.16 | 0.2921 | -1598.5 | 999999 | |
| 9 | -1 | 5 | -1 | -18.44 | 125.56 | -3.42 | 168.48 | 0.2845 | -1737.1 | 999999 | |
| 2 | -1 | 1 | -1 | -18.19 | 125.11 | -3.87 | 166.81 | 0.2821 | -1389.6 | 999999 | |
| 0 | 5 | 0 | 3 | -18.60 | 125.06 | -3.92 | 166.99 | 0.2890 | -905.0 | -791.6 | |
| 0 | 7 | 0 | 3 | -17.46 | 125.09 | -3.89 | 166.07 | 0.2702 | -873.0 | -782.5 | |
| 6 | 16 | 3 | 8 | -18.48 | 124.61 | -4.37 | 165.43 | 0.2888 | -1304.9 | -961.7 | |
| 0 | 5 | 0 | 3 | -19.46 | 124.25 | -4.73 | 165.21 | 0.3062 | -793.0 | -579.2 | |
| 0 | 10 | 0 | 5 | -17.54 | 124.01 | -4.97 | 162.53 | 0.2764 | -1148.0 | -919.9 | |
| 0 | 3 | 0 | 2 | -21.57 | 123.50 | -5.48 | 164.93 | 0.3430 | -1004.0 | -743.0 | |
| 0 | 4 | 0 | 2 | -18.51 | 123.44 | -5.54 | 161.83 | 0.2949 | -1100.0 | -913.3 | |
| 3 | 6 | 2 | 3 | -18.15 | 123.41 | -5.57 | 161.32 | 0.2892 | -1164.1 | -1055.2 | |
| 0 | 4 | 0 | 2 | -19.57 | 120.97 | -8.01 | 156.13 | 0.3260 | -889.0 | -732.7 | |
| 3 | 10 | 2 | 5 | -19.81 | 120.24 | -8.74 | 154.59 | 0.3346 | -1130.2 | -636.1 | |
| 0 | 4 | 0 | 2 | -20.34 | 118.42 | -10.56 | 151.00 | 0.3558 | 223.0 | 458.4 | |
| 0 | 3 | 0 | 2 | -20.79 | 118.26 | -10.72 | 151.29 | 0.3634 | -567.0 | -348.9 | |
| 0 | 4 | 0 | 2 | -20.29 | 117.66 | -11.32 | 149.22 | 0.3614 | -641.0 | -442.9 | |
| 0 | 9 | 0 | 5 | -21.74 | 116.94 | -12.04 | 149.82 | 0.3871 | 766.0 | 746.8 | |
| 0 | 4 | 0 | 2 | -20.53 | 116.65 | -12.32 | 147.46 | 0.3732 | 592.0 | 498.2 | |
| 0 | 7 | 0 | 4 | -21.44 | 116.36 | -12.62 | 148.23 | 0.3879 | 987.0 | 751.8 | |
| 0 | 8 | 0 | 4 | -20.90 | 116.02 | -12.96 | 146.74 | 0.3837 | 1080.0 | 969.1 | |
| 0 | 9 | 0 | 5 | -21.44 | 115.88 | -13.09 | 147.29 | 0.3919 | 885.0 | 722.3 | |
| 0 | 4 | 0 | 2 | -19.99 | 115.93 | -13.05 | 145.11 | 0.3727 | 984.0 | 814.1 | |
| 3 | 7 | 1 | 4 | -20.61 | 115.66 | -13.32 | 145.57 | 0.3831 | 1393.9 | 1138.5 | |
| 0 | 5 | 0 | 3 | -19.86 | 115.46 | -13.51 | 143.98 | 0.3754 | 1090.0 | 942.1 | |
| 3 | 11 | 2 | 6 | -20.93 | 115.28 | -13.70 | 145.36 | 0.3908 | 1409.8 | 1310.8 | |
| 0 | 12 | 0 | 6 | -19.94 | 115.11 | -13.87 | 143.43 | 0.3797 | 1370.0 | 1156.9 | |
| 0 | 6 | 0 | 3 | -19.28 | 115.17 | -13.81 | 142.42 | 0.3709 | 938.0 | 893.6 | |
| 0 | 5 | 0 | 3 | -19.52 | 114.76 | -14.22 | 142.05 | 0.3780 | 1080.0 | 882.8 | |
| 15 | 288 | 8 | 156 | -21.63 | 114.52 | -14.46 | 145.02 | 0.4067 | 1603.4 | 662.0 | |
| 11 | -30 | 6 | -30 | -21.22 | 114.43 | -14.55 | 144.22 | 0.4023 | 1988.7 | 999999 | |
| 7 | -30 | 4 | -30 | -21.34 | 114.02 | -14.96 | 143.68 | 0.4076 | 1255.8 | 999999 | |
| 0 | 4 | 0 | 2 | -19.14 | 113.68 | -15.30 | 139.38 | 0.3846 | 803.0 | 648.1 | |
| 0 | 4 | 0 | 2 | -19.51 | 113.56 | -15.42 | 139.82 | 0.3902 | 793.0 | 758.0 | |
| Proj. U | - Projected umbra area in millionths of solar disc, negative values indicate | |
|
that the umbra consists of fragmented regions which cannot be separated without losing umbral area. In this way several spots (intensity minima in the umbra) have a common umbra, e.g. -2 means that the given spot shares an umbra with spot No.2, and the common U value is indicated at spot No.2. |
||
| Proj. WS | - Projected whole spot area in millionths of solar disc, negative values indicate | |
|
that several umbras have a common penumbra, e.g. -7 means that the given umbra shares a penumbra with umbra No.7, and the WS value is indicated at No.7. |
||
| Corr. U | - Corrected umbra area in millionths of solar hemisphere, for negative values see above | |
| Corr. WS | - Corrected whole spot area in millionths of solar hemisphere, for negative values see above | |
| B | - Heliographic latitude B; positive: North, negative: South | |
| L | - Heliographic longitude L | |
| LCM | - Longitudinal distance from the Sun's central meridian | |
| Pos. angle | - Position angle | |
| r | - Distance from the centre of Sun's disc in terms of Sun's radius | |
| MU | - Mean magnetic field within the umbra contour averaged the pixel values with sign. | |
| MP | - Mean magnetic field within the penumbra contour averaged the pixel values with sign. | |