SOHO MDI 1999-05-18 19:11:33 UT
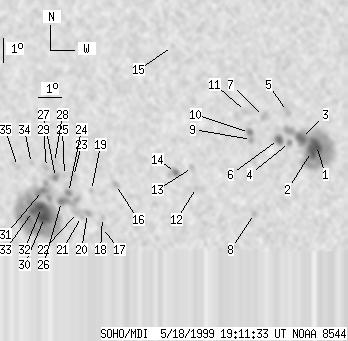
| group | Proj. U | Proj. WS | Corr. U | Corr. WS | B | L | LCM | Pos. angle | r | MU | MP |
| 87 | 667 | 45 | 355 | -20.15 | 118.81 | -9.80 | 154.41 | 0.3536 | 66.4 | 142.5 | |
|
previous
or next observation for the same group /
back to the solar disc SOHO MDI 1999-05-18 19:11:33 UT |
| spot | Proj. U | Proj. WS | Corr. U | Corr. WS | B | L | LCM | Pos. angle | r | MU | MP |
| 12 | 185 | 6 | 96 | -18.72 | 126.19 | -2.42 | 171.93 | 0.2864 | -1987.7 | -794.8 | |
| 10 | -1 | 5 | -1 | -18.97 | 125.98 | -2.64 | 171.37 | 0.2910 | -1522.2 | 999999 | |
| 9 | -1 | 5 | -1 | -18.43 | 125.57 | -3.04 | 169.72 | 0.2833 | -1763.7 | 999999 | |
| 0 | 7 | 0 | 4 | -18.60 | 125.07 | -3.54 | 168.20 | 0.2876 | -1106.0 | -607.1 | |
| 0 | 10 | 0 | 5 | -17.33 | 125.01 | -3.60 | 166.97 | 0.2671 | -944.0 | -707.8 | |
| 6 | 15 | 3 | 8 | -18.47 | 124.61 | -4.00 | 166.63 | 0.2872 | -1333.2 | -900.4 | |
| 0 | 10 | 0 | 5 | -17.53 | 124.02 | -4.60 | 163.77 | 0.2746 | -1065.0 | -938.7 | |
| 0 | 4 | 0 | 2 | -21.52 | 123.52 | -5.09 | 165.91 | 0.3407 | -861.0 | -733.5 | |
| 0 | 5 | 0 | 3 | -18.47 | 123.49 | -5.12 | 163.08 | 0.2921 | -985.0 | -782.9 | |
| 3 | 6 | 1 | 3 | -18.18 | 123.42 | -5.19 | 162.54 | 0.2879 | -1089.7 | -903.5 | |
| 0 | 5 | 0 | 2 | -17.33 | 123.28 | -5.33 | 161.09 | 0.2750 | -962.0 | -859.3 | |
| 0 | 3 | 0 | 2 | -20.43 | 121.11 | -7.50 | 158.53 | 0.3358 | -671.0 | -472.3 | |
| 0 | 3 | 0 | 2 | -19.61 | 120.98 | -7.63 | 157.19 | 0.3241 | -806.0 | -739.2 | |
| 3 | 12 | 2 | 6 | -19.81 | 120.25 | -8.36 | 155.56 | 0.3319 | -976.2 | -544.6 | |
| 0 | 3 | 0 | 1 | -14.68 | 120.36 | -8.25 | 147.09 | 0.2566 | -558.0 | -446.5 | |
| 0 | 6 | 0 | 3 | -20.29 | 117.68 | -10.93 | 150.08 | 0.3582 | -568.0 | -330.0 | |
| 0 | 8 | 0 | 4 | -22.07 | 116.98 | -11.63 | 151.11 | 0.3884 | 789.0 | 604.0 | |
| 0 | 4 | 0 | 2 | -21.65 | 117.02 | -11.60 | 150.61 | 0.3824 | 854.0 | 677.8 | |
| 0 | 3 | 0 | 2 | -20.53 | 116.63 | -11.98 | 148.18 | 0.3702 | 804.0 | 599.8 | |
| 0 | 5 | 0 | 3 | -21.48 | 116.38 | -12.23 | 149.07 | 0.3852 | 932.0 | 664.0 | |
| 0 | 2 | 0 | 1 | -21.60 | 116.11 | -12.50 | 148.71 | 0.3891 | 811.0 | 767.6 | |
| 0 | 6 | 0 | 3 | -21.44 | 115.95 | -12.66 | 148.15 | 0.3882 | 572.0 | 711.3 | |
| 0 | 6 | 0 | 3 | -19.94 | 115.91 | -12.70 | 145.75 | 0.3689 | 1108.0 | 884.8 | |
| 3 | 36 | 1 | 20 | -20.60 | 115.64 | -12.97 | 146.26 | 0.3800 | 1455.6 | 1084.5 | |
| 0 | 2 | 0 | 1 | -19.90 | 115.53 | -13.09 | 144.90 | 0.3719 | 1103.0 | 998.8 | |
| 3 | -24 | 2 | -24 | -20.97 | 115.30 | -13.31 | 146.17 | 0.3878 | 1443.7 | 999999 | |
| 3 | 15 | 2 | 8 | -19.98 | 115.13 | -13.48 | 144.25 | 0.3766 | 1397.7 | 1059.9 | |
| 0 | 7 | 0 | 4 | -19.36 | 115.14 | -13.47 | 143.23 | 0.3687 | 1150.0 | 899.8 | |
| 0 | 6 | 0 | 3 | -19.56 | 114.78 | -13.83 | 142.87 | 0.3747 | 858.0 | 798.6 | |
| 29 | 281 | 15 | 152 | -21.63 | 114.50 | -14.11 | 145.66 | 0.4035 | 1764.9 | 654.3 | |
| 2 | -30 | 1 | -30 | -20.51 | 114.52 | -14.09 | 143.95 | 0.3891 | 1568.5 | 999999 | |
| -30 | -30 | -30 | -30 | -21.22 | 114.41 | -14.20 | 144.86 | 0.3990 | 999999 | 999999 | |
| 4 | -30 | 2 | -30 | -21.38 | 114.00 | -14.61 | 144.37 | 0.4049 | 1320.8 | 999999 | |
| 0 | 4 | 0 | 2 | -19.39 | 114.15 | -14.46 | 141.37 | 0.3789 | 803.0 | 600.1 | |
| 0 | 8 | 0 | 5 | -19.51 | 113.54 | -15.07 | 140.44 | 0.3866 | 765.0 | 695.6 | |
| Proj. U | - Projected umbra area in millionths of solar disc, negative values indicate | |
|
that the umbra consists of fragmented regions which cannot be separated without losing umbral area. In this way several spots (intensity minima in the umbra) have a common umbra, e.g. -2 means that the given spot shares an umbra with spot No.2, and the common U value is indicated at spot No.2. |
||
| Proj. WS | - Projected whole spot area in millionths of solar disc, negative values indicate | |
|
that several umbras have a common penumbra, e.g. -7 means that the given umbra shares a penumbra with umbra No.7, and the WS value is indicated at No.7. |
||
| Corr. U | - Corrected umbra area in millionths of solar hemisphere, for negative values see above | |
| Corr. WS | - Corrected whole spot area in millionths of solar hemisphere, for negative values see above | |
| B | - Heliographic latitude B; positive: North, negative: South | |
| L | - Heliographic longitude L | |
| LCM | - Longitudinal distance from the Sun's central meridian | |
| Pos. angle | - Position angle | |
| r | - Distance from the centre of Sun's disc in terms of Sun's radius | |
| MU | - Mean magnetic field within the umbra contour averaged the pixel values with sign. | |
| MP | - Mean magnetic field within the penumbra contour averaged the pixel values with sign. | |