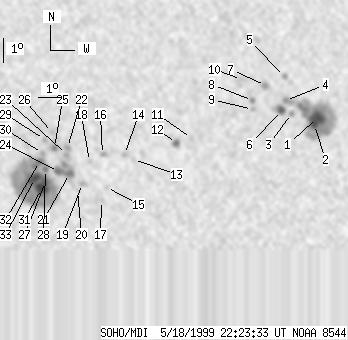
SOHO MDI 1999-05-18 22:23:33 UT
| group | Proj. U | Proj. WS | Corr. U | Corr. WS | B | L | LCM | Pos. angle | r | MU | MP |
| 80 | 609 | 43 | 323 | -20.21 | 118.83 | -8.02 | 158.93 | 0.3436 | 224.2 | 139.6 | |
|
previous
or next observation for the same group /
back to the solar disc SOHO MDI 1999-05-18 22:23:33 UT |
| spot | Proj. U | Proj. WS | Corr. U | Corr. WS | B | L | LCM | Pos. angle | r | MU | MP |
| 17 | 160 | 9 | 83 | -18.79 | 126.25 | -0.60 | 177.99 | 0.2852 | -1892.3 | -808.6 | |
| 5 | -1 | 3 | -1 | -19.08 | 126.12 | -0.73 | 177.62 | 0.2901 | -1486.2 | 999999 | |
| 0 | 4 | 0 | 2 | -18.63 | 125.17 | -1.68 | 174.36 | 0.2836 | -977.0 | -703.0 | |
| 0 | 8 | 0 | 4 | -18.09 | 124.93 | -1.92 | 173.32 | 0.2751 | -1526.0 | -1327.2 | |
| 0 | 5 | 0 | 3 | -17.12 | 124.90 | -1.95 | 172.74 | 0.2588 | -1201.0 | -837.8 | |
| 5 | 17 | 3 | 9 | -18.50 | 124.76 | -2.09 | 172.92 | 0.2823 | -1303.9 | -872.1 | |
| 0 | 7 | 0 | 4 | -17.48 | 124.11 | -2.74 | 170.12 | 0.2669 | -1331.0 | -952.8 | |
| 0 | 5 | 0 | 3 | -18.09 | 123.56 | -3.29 | 168.67 | 0.2787 | -1377.0 | -933.1 | |
| 0 | 3 | 0 | 2 | -18.46 | 123.56 | -3.29 | 168.92 | 0.2848 | -958.0 | -758.2 | |
| 0 | 12 | 0 | 6 | -17.24 | 123.12 | -3.72 | 166.46 | 0.2662 | -912.0 | -776.5 | |
| 0 | 3 | 0 | 1 | -19.64 | 120.98 | -5.87 | 162.09 | 0.3147 | -762.0 | -590.8 | |
| 4 | 10 | 2 | 5 | -19.85 | 120.34 | -6.51 | 160.53 | 0.3213 | -1078.5 | -654.3 | |
| 0 | 3 | 0 | 2 | -20.50 | 118.49 | -8.36 | 156.47 | 0.3424 | -538.0 | -282.9 | |
| 0 | 5 | 0 | 2 | -20.29 | 118.12 | -8.73 | 155.28 | 0.3418 | -709.0 | -530.3 | |
| 0 | 3 | 0 | 2 | -21.65 | 117.27 | -9.58 | 155.01 | 0.3676 | 877.0 | 856.6 | |
| 0 | 5 | 0 | 3 | -20.28 | 117.19 | -9.66 | 153.02 | 0.3484 | 786.0 | 679.3 | |
| 0 | 2 | 0 | 1 | -22.19 | 117.02 | -9.83 | 155.11 | 0.3772 | 821.0 | 740.7 | |
| 0 | 4 | 0 | 2 | -20.57 | 116.62 | -10.23 | 152.09 | 0.3568 | 281.0 | 254.1 | |
| 0 | 6 | 0 | 3 | -21.48 | 116.25 | -10.60 | 152.52 | 0.3725 | 955.0 | 692.3 | |
| 0 | 3 | 0 | 2 | -21.77 | 116.02 | -10.83 | 152.40 | 0.3783 | 682.0 | 626.0 | |
| 4 | 48 | 2 | 25 | -21.06 | 115.73 | -11.12 | 150.80 | 0.3706 | 1336.6 | 1071.7 | |
| 0 | 6 | 0 | 3 | -19.98 | 115.72 | -11.13 | 149.20 | 0.3558 | 1280.0 | 963.4 | |
| 0 | 3 | 0 | 2 | -20.27 | 115.66 | -11.19 | 149.50 | 0.3603 | 1279.0 | 1173.8 | |
| 6 | -21 | 3 | -21 | -20.97 | 115.26 | -11.59 | 149.68 | 0.3732 | 1484.3 | 999999 | |
| 2 | 10 | 1 | 5 | -19.98 | 115.17 | -11.68 | 147.98 | 0.3605 | 1500.0 | 1167.7 | |
| 0 | 3 | 0 | 2 | -19.36 | 115.13 | -11.72 | 146.90 | 0.3525 | 1183.0 | 999.5 | |
| 5 | 264 | 3 | 142 | -21.38 | 114.67 | -12.18 | 149.05 | 0.3837 | 1850.3 | 683.1 | |
| 2 | -27 | 1 | -27 | -20.89 | 114.71 | -12.14 | 148.40 | 0.3766 | 1439.8 | 999999 | |
| 0 | 5 | 0 | 2 | -19.65 | 114.76 | -12.08 | 146.58 | 0.3596 | 1122.0 | 908.6 | |
| 0 | 5 | 0 | 3 | -20.22 | 114.63 | -12.22 | 147.23 | 0.3684 | 1163.0 | 941.0 | |
| 14 | -27 | 7 | -27 | -21.67 | 114.47 | -12.38 | 149.07 | 0.3893 | 1591.2 | 999999 | |
| 3 | -27 | 2 | -27 | -20.55 | 114.48 | -12.37 | 147.42 | 0.3742 | 1489.4 | 999999 | |
| 13 | -27 | 7 | -27 | -21.26 | 114.20 | -12.65 | 147.93 | 0.3859 | 1719.3 | 999999 | |
| Proj. U | - Projected umbra area in millionths of solar disc, negative values indicate | |
|
that the umbra consists of fragmented regions which cannot be separated without losing umbral area. In this way several spots (intensity minima in the umbra) have a common umbra, e.g. -2 means that the given spot shares an umbra with spot No.2, and the common U value is indicated at spot No.2. |
||
| Proj. WS | - Projected whole spot area in millionths of solar disc, negative values indicate | |
|
that several umbras have a common penumbra, e.g. -7 means that the given umbra shares a penumbra with umbra No.7, and the WS value is indicated at No.7. |
||
| Corr. U | - Corrected umbra area in millionths of solar hemisphere, for negative values see above | |
| Corr. WS | - Corrected whole spot area in millionths of solar hemisphere, for negative values see above | |
| B | - Heliographic latitude B; positive: North, negative: South | |
| L | - Heliographic longitude L | |
| LCM | - Longitudinal distance from the Sun's central meridian | |
| Pos. angle | - Position angle | |
| r | - Distance from the centre of Sun's disc in terms of Sun's radius | |
| MU | - Mean magnetic field within the umbra contour averaged the pixel values with sign. | |
| MP | - Mean magnetic field within the penumbra contour averaged the pixel values with sign. | |