SOHO MDI 1999-05-18 23:59:33 UT
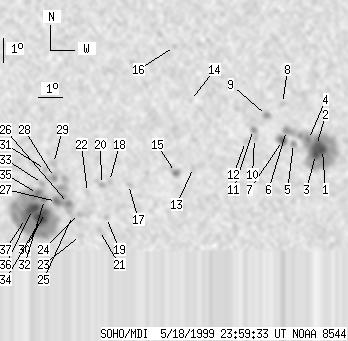
| group | Proj. U | Proj. WS | Corr. U | Corr. WS | B | L | LCM | Pos. angle | r | MU | MP |
| 79 | 636 | 41 | 339 | -20.27 | 118.67 | -7.30 | 160.83 | 0.3405 | 276.7 | 164.9 | |
|
previous
or next observation for the same group /
back to the solar disc SOHO MDI 1999-05-18 23:59:33 UT |
| spot | Proj. U | Proj. WS | Corr. U | Corr. WS | B | L | LCM | Pos. angle | r | MU | MP |
| 6 | 156 | 3 | 81 | -18.86 | 126.45 | 0.48 | 181.59 | 0.2865 | -1777.6 | -818.5 | |
| 7 | -1 | 4 | -1 | -18.70 | 126.20 | 0.23 | 180.77 | 0.2836 | -2001.9 | 999999 | |
| 5 | -1 | 3 | -1 | -19.07 | 126.16 | 0.19 | 180.62 | 0.2898 | -1476.7 | 999999 | |
| 1 | -1 | 0 | -1 | -18.45 | 125.87 | -0.10 | 179.65 | 0.2795 | -1739.7 | 999999 | |
| 0 | 5 | 0 | 3 | -18.62 | 125.24 | -0.72 | 177.56 | 0.2825 | -650.0 | -598.8 | |
| 0 | 19 | 0 | 10 | -18.09 | 124.96 | -1.01 | 176.47 | 0.2738 | -1529.0 | -1165.7 | |
| 6 | 14 | 3 | 7 | -18.50 | 124.79 | -1.18 | 176.00 | 0.2808 | -1301.2 | -958.5 | |
| 0 | 4 | 0 | 2 | -16.99 | 124.80 | -1.17 | 175.60 | 0.2554 | -888.0 | -841.1 | |
| 0 | 8 | 0 | 4 | -17.47 | 124.14 | -1.83 | 173.36 | 0.2647 | -1190.0 | -920.4 | |
| 0 | 3 | 0 | 2 | -18.41 | 123.63 | -2.34 | 172.06 | 0.2815 | -868.0 | -668.8 | |
| 0 | 5 | 0 | 3 | -18.04 | 123.59 | -2.37 | 171.74 | 0.2754 | -1124.0 | -930.5 | |
| 0 | 5 | 0 | 2 | -18.53 | 123.25 | -2.71 | 170.88 | 0.2844 | -808.0 | -664.0 | |
| 0 | 5 | 0 | 3 | -19.60 | 121.06 | -4.90 | 164.85 | 0.3095 | -468.0 | -519.4 | |
| 0 | 3 | 0 | 1 | -16.86 | 121.02 | -4.95 | 161.82 | 0.2659 | -725.0 | -715.0 | |
| 3 | 7 | 1 | 4 | -19.80 | 120.30 | -5.67 | 162.84 | 0.3163 | -1232.2 | -843.3 | |
| 0 | 3 | 0 | 2 | -14.67 | 120.42 | -5.55 | 156.42 | 0.2350 | -680.0 | -552.2 | |
| 0 | 5 | 0 | 3 | -20.29 | 118.30 | -7.67 | 157.96 | 0.3349 | -865.0 | -597.7 | |
| 0 | 3 | 0 | 2 | -20.16 | 117.50 | -8.46 | 155.77 | 0.3382 | -110.0 | -175.1 | |
| 0 | 3 | 0 | 2 | -21.65 | 117.29 | -8.68 | 157.09 | 0.3617 | 898.0 | 866.4 | |
| 0 | 4 | 0 | 2 | -20.28 | 117.16 | -8.81 | 155.07 | 0.3423 | 626.0 | 548.4 | |
| 0 | 9 | 0 | 5 | -22.19 | 116.96 | -9.01 | 156.94 | 0.3719 | 726.0 | 583.2 | |
| 0 | 4 | 0 | 2 | -20.61 | 116.54 | -9.42 | 154.03 | 0.3515 | 491.0 | 339.9 | |
| 0 | 4 | 0 | 2 | -22.39 | 116.12 | -9.84 | 155.33 | 0.3803 | 430.0 | 378.9 | |
| 0 | 4 | 0 | 2 | -21.48 | 116.15 | -9.82 | 154.24 | 0.3669 | 855.0 | 811.2 | |
| 0 | 2 | 0 | 1 | -21.56 | 115.84 | -10.13 | 153.66 | 0.3702 | 897.0 | 800.0 | |
| 2 | 66 | 1 | 35 | -21.06 | 115.70 | -10.26 | 152.70 | 0.3641 | 1363.5 | 1119.8 | |
| 5 | -26 | 2 | -26 | -20.97 | 115.20 | -10.77 | 151.45 | 0.3668 | 1563.3 | 999999 | |
| 0 | 11 | 0 | 6 | -19.98 | 115.18 | -10.79 | 149.97 | 0.3530 | 1596.0 | 1131.8 | |
| 0 | 5 | 0 | 3 | -19.40 | 115.18 | -10.79 | 149.07 | 0.3450 | 1042.0 | 965.9 | |
| 5 | 269 | 3 | 144 | -21.42 | 114.69 | -11.28 | 150.99 | 0.3770 | 1789.8 | 684.1 | |
| 0 | 5 | 0 | 3 | -19.65 | 114.82 | -11.15 | 148.65 | 0.3514 | 1134.0 | 861.5 | |
| 1 | -30 | 1 | -30 | -20.88 | 114.69 | -11.28 | 150.22 | 0.3696 | 1569.2 | 999999 | |
| 0 | 5 | 0 | 3 | -20.22 | 114.65 | -11.32 | 149.16 | 0.3608 | 1128.0 | 916.5 | |
| 19 | -30 | 10 | -30 | -21.71 | 114.45 | -11.52 | 150.89 | 0.3829 | 1543.4 | 999999 | |
| 4 | -30 | 2 | -30 | -20.63 | 114.41 | -11.56 | 149.25 | 0.3684 | 1567.9 | 999999 | |
| 13 | -30 | 7 | -30 | -21.30 | 114.14 | -11.83 | 149.66 | 0.3797 | 1660.1 | 999999 | |
| 2 | -30 | 1 | -30 | -21.67 | 113.81 | -12.16 | 149.50 | 0.3875 | 1093.9 | 999999 | |
| Proj. U | - Projected umbra area in millionths of solar disc, negative values indicate | |
|
that the umbra consists of fragmented regions which cannot be separated without losing umbral area. In this way several spots (intensity minima in the umbra) have a common umbra, e.g. -2 means that the given spot shares an umbra with spot No.2, and the common U value is indicated at spot No.2. |
||
| Proj. WS | - Projected whole spot area in millionths of solar disc, negative values indicate | |
|
that several umbras have a common penumbra, e.g. -7 means that the given umbra shares a penumbra with umbra No.7, and the WS value is indicated at No.7. |
||
| Corr. U | - Corrected umbra area in millionths of solar hemisphere, for negative values see above | |
| Corr. WS | - Corrected whole spot area in millionths of solar hemisphere, for negative values see above | |
| B | - Heliographic latitude B; positive: North, negative: South | |
| L | - Heliographic longitude L | |
| LCM | - Longitudinal distance from the Sun's central meridian | |
| Pos. angle | - Position angle | |
| r | - Distance from the centre of Sun's disc in terms of Sun's radius | |
| MU | - Mean magnetic field within the umbra contour averaged the pixel values with sign. | |
| MP | - Mean magnetic field within the penumbra contour averaged the pixel values with sign. | |