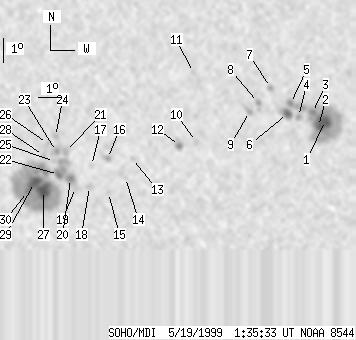
SOHO MDI 1999-05-19 01:35:33 UT
| group | Proj. U | Proj. WS | Corr. U | Corr. WS | B | L | LCM | Pos. angle | r | MU | MP |
| 81 | 618 | 41 | 327 | -20.33 | 118.68 | -6.41 | 163.30 | 0.3375 | 132.7 | 226.0 | |
|
previous
or next observation for the same group /
back to the solar disc SOHO MDI 1999-05-19 01:35:33 UT |
| spot | Proj. U | Proj. WS | Corr. U | Corr. WS | B | L | LCM | Pos. angle | r | MU | MP |
| 23 | 156 | 12 | 80 | -18.78 | 126.44 | 1.35 | 184.50 | 0.2859 | -1798.8 | -701.1 | |
| -1 | -1 | -1 | -1 | -19.03 | 126.15 | 1.06 | 183.48 | 0.2897 | 999999 | 999999 | |
| 3 | -1 | 1 | -1 | -18.45 | 125.90 | 0.81 | 182.76 | 0.2799 | -1679.4 | 999999 | |
| 0 | 7 | 0 | 4 | -18.62 | 125.32 | 0.23 | 180.78 | 0.2823 | -744.0 | -629.9 | |
| 3 | 19 | 1 | 10 | -18.08 | 124.99 | -0.10 | 179.65 | 0.2733 | -1608.3 | -1116.9 | |
| 6 | 15 | 3 | 8 | -18.49 | 124.86 | -0.23 | 179.23 | 0.2803 | -1295.2 | -873.3 | |
| 0 | 4 | 0 | 2 | -17.43 | 124.16 | -0.92 | 176.63 | 0.2628 | -1261.0 | -1029.2 | |
| 0 | 9 | 0 | 5 | -18.04 | 123.66 | -1.42 | 175.03 | 0.2737 | -1190.0 | -749.4 | |
| 0 | 7 | 0 | 4 | -18.41 | 123.29 | -1.80 | 173.87 | 0.2804 | -1139.0 | -840.3 | |
| 0 | 5 | 0 | 3 | -19.64 | 121.06 | -4.03 | 167.49 | 0.3068 | -362.0 | -348.3 | |
| 0 | 2 | 0 | 1 | -16.82 | 121.00 | -4.09 | 164.79 | 0.2611 | -717.0 | -673.2 | |
| 3 | 10 | 2 | 5 | -19.80 | 120.34 | -4.74 | 165.51 | 0.3122 | -1226.3 | -782.4 | |
| 0 | 3 | 0 | 2 | -20.33 | 118.35 | -6.74 | 160.45 | 0.3303 | -565.0 | -478.1 | |
| 0 | 2 | 0 | 1 | -21.11 | 118.02 | -7.07 | 160.42 | 0.3442 | -569.0 | -445.2 | |
| 0 | 3 | 0 | 2 | -21.74 | 117.26 | -7.83 | 159.21 | 0.3580 | 661.0 | 531.1 | |
| 0 | 5 | 0 | 3 | -20.32 | 117.29 | -7.79 | 157.68 | 0.3364 | 774.0 | 560.2 | |
| 0 | 3 | 0 | 2 | -20.61 | 116.60 | -8.49 | 156.30 | 0.3452 | 389.0 | 296.1 | |
| 0 | 6 | 0 | 3 | -21.48 | 116.46 | -8.62 | 157.02 | 0.3590 | 809.0 | 772.9 | |
| 0 | 2 | 0 | 1 | -21.52 | 115.86 | -9.22 | 155.67 | 0.3635 | 878.0 | 878.0 | |
| 5 | 54 | 2 | 29 | -21.14 | 115.67 | -9.41 | 154.76 | 0.3593 | 1354.2 | 1167.9 | |
| 0 | 9 | 0 | 5 | -20.02 | 115.53 | -9.56 | 152.92 | 0.3441 | 1092.0 | 981.2 | |
| 4 | -20 | 2 | -20 | -20.97 | 115.17 | -9.92 | 153.38 | 0.3604 | 1591.4 | 999999 | |
| 0 | 9 | 0 | 5 | -20.02 | 115.15 | -9.94 | 152.01 | 0.3470 | 1573.0 | 1124.7 | |
| 0 | 5 | 0 | 2 | -19.40 | 115.14 | -9.94 | 151.08 | 0.3382 | 1227.0 | 1045.8 | |
| 0 | 2 | 0 | 1 | -20.43 | 115.04 | -10.05 | 152.33 | 0.3537 | 1124.0 | 1031.1 | |
| 0 | 5 | 0 | 2 | -19.69 | 114.79 | -10.30 | 150.67 | 0.3451 | 1180.0 | 929.3 | |
| 18 | 272 | 9 | 145 | -21.64 | 114.48 | -10.61 | 152.73 | 0.3750 | 1683.4 | 698.4 | |
| 0 | 4 | 0 | 2 | -20.18 | 114.58 | -10.50 | 150.94 | 0.3537 | 883.0 | 886.2 | |
| 13 | -27 | 7 | -27 | -21.30 | 114.12 | -10.97 | 151.49 | 0.3730 | 1696.8 | 999999 | |
| 3 | -27 | 2 | -27 | -21.67 | 113.79 | -11.30 | 151.30 | 0.3807 | 1106.4 | 999999 | |
| Proj. U | - Projected umbra area in millionths of solar disc, negative values indicate | |
|
that the umbra consists of fragmented regions which cannot be separated without losing umbral area. In this way several spots (intensity minima in the umbra) have a common umbra, e.g. -2 means that the given spot shares an umbra with spot No.2, and the common U value is indicated at spot No.2. |
||
| Proj. WS | - Projected whole spot area in millionths of solar disc, negative values indicate | |
|
that several umbras have a common penumbra, e.g. -7 means that the given umbra shares a penumbra with umbra No.7, and the WS value is indicated at No.7. |
||
| Corr. U | - Corrected umbra area in millionths of solar hemisphere, for negative values see above | |
| Corr. WS | - Corrected whole spot area in millionths of solar hemisphere, for negative values see above | |
| B | - Heliographic latitude B; positive: North, negative: South | |
| L | - Heliographic longitude L | |
| LCM | - Longitudinal distance from the Sun's central meridian | |
| Pos. angle | - Position angle | |
| r | - Distance from the centre of Sun's disc in terms of Sun's radius | |
| MU | - Mean magnetic field within the umbra contour averaged the pixel values with sign. | |
| MP | - Mean magnetic field within the penumbra contour averaged the pixel values with sign. | |