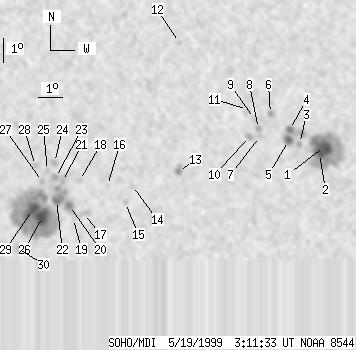
SOHO MDI 1999-05-19 03:11:33 UT
| group | Proj. U | Proj. WS | Corr. U | Corr. WS | B | L | LCM | Pos. angle | r | MU | MP |
| 76 | 632 | 39 | 332 | -20.28 | 118.85 | -5.35 | 166.13 | 0.3325 | 33.2 | 194.5 | |
|
previous
or next observation for the same group /
back to the solar disc SOHO MDI 1999-05-19 03:11:33 UT |
| spot | Proj. U | Proj. WS | Corr. U | Corr. WS | B | L | LCM | Pos. angle | r | MU | MP |
| 16 | 157 | 9 | 81 | -18.77 | 126.43 | 2.22 | 187.37 | 0.2874 | -1883.8 | -689.2 | |
| 8 | -1 | 4 | -1 | -19.06 | 126.22 | 2.02 | 186.58 | 0.2918 | -1512.1 | 999999 | |
| 0 | 4 | 0 | 2 | -18.65 | 125.39 | 1.18 | 183.97 | 0.2836 | -1144.0 | -760.2 | |
| 5 | 43 | 2 | 22 | -18.07 | 124.97 | 0.77 | 182.67 | 0.2736 | -1449.9 | -962.3 | |
| 6 | -4 | 3 | -4 | -18.52 | 124.93 | 0.73 | 182.46 | 0.2812 | -1360.7 | 999999 | |
| 0 | 5 | 0 | 3 | -17.42 | 124.19 | -0.02 | 179.93 | 0.2623 | -1304.0 | -1055.0 | |
| 0 | 3 | 0 | 2 | -18.36 | 123.73 | -0.48 | 178.37 | 0.2782 | -596.0 | -476.2 | |
| 0 | 4 | 0 | 2 | -18.03 | 123.69 | -0.52 | 178.19 | 0.2728 | -1042.0 | -842.8 | |
| 0 | 5 | 0 | 3 | -17.63 | 123.53 | -0.68 | 177.55 | 0.2660 | -1071.0 | -891.1 | |
| 0 | 6 | 0 | 3 | -18.36 | 123.32 | -0.89 | 176.96 | 0.2785 | -1005.0 | -864.3 | |
| 0 | 7 | 0 | 4 | -17.26 | 123.24 | -0.97 | 176.43 | 0.2600 | -461.0 | -740.5 | |
| 0 | 3 | 0 | 1 | -14.55 | 120.49 | -3.72 | 163.55 | 0.2225 | -794.0 | -635.9 | |
| 3 | 10 | 1 | 5 | -19.79 | 120.34 | -3.86 | 168.10 | 0.3089 | -1295.4 | -808.4 | |
| 0 | 4 | 0 | 2 | -20.37 | 118.39 | -5.81 | 162.99 | 0.3262 | -775.0 | -644.0 | |
| 0 | 4 | 0 | 2 | -21.07 | 118.07 | -6.14 | 162.79 | 0.3388 | -237.0 | -238.5 | |
| 0 | 3 | 0 | 2 | -20.36 | 117.34 | -6.87 | 160.15 | 0.3316 | 745.0 | 570.4 | |
| 0 | 9 | 0 | 5 | -21.52 | 116.30 | -7.90 | 158.80 | 0.3552 | 753.0 | 719.6 | |
| 0 | 3 | 0 | 2 | -20.15 | 116.16 | -8.04 | 156.85 | 0.3355 | 541.0 | 546.0 | |
| 0 | 1 | 0 | 1 | -21.72 | 115.82 | -8.38 | 157.88 | 0.3612 | 674.0 | 639.2 | |
| 5 | 21 | 2 | 11 | -21.18 | 115.68 | -8.52 | 156.92 | 0.3540 | 1318.3 | 990.2 | |
| 0 | 8 | 0 | 4 | -20.19 | 115.44 | -8.76 | 155.08 | 0.3409 | 1143.0 | 943.8 | |
| 5 | 32 | 3 | 17 | -20.97 | 115.14 | -9.06 | 155.37 | 0.3545 | 1462.6 | 1285.8 | |
| 0 | 6 | 0 | 3 | -20.02 | 115.16 | -9.05 | 154.15 | 0.3404 | 1379.0 | 1144.9 | |
| 0 | 6 | 0 | 3 | -19.40 | 115.15 | -9.06 | 153.27 | 0.3315 | 1338.0 | 1049.7 | |
| 0 | 4 | 0 | 2 | -19.73 | 114.83 | -9.37 | 152.96 | 0.3386 | 1032.0 | 884.8 | |
| 18 | 267 | 10 | 142 | -21.63 | 114.50 | -9.71 | 154.72 | 0.3685 | 1680.9 | 724.1 | |
| 0 | 4 | 0 | 2 | -20.18 | 114.59 | -9.61 | 153.02 | 0.3469 | 994.0 | 835.2 | |
| 0 | 5 | 0 | 2 | -19.52 | 114.34 | -9.87 | 151.45 | 0.3394 | 1069.0 | 903.6 | |
| 10 | -26 | 5 | -26 | -21.34 | 114.09 | -10.11 | 153.43 | 0.3672 | 1731.7 | 999999 | |
| 0 | 8 | 0 | 4 | -22.96 | 113.32 | -10.88 | 153.83 | 0.3959 | -461.0 | -223.3 | |
| Proj. U | - Projected umbra area in millionths of solar disc, negative values indicate | |
|
that the umbra consists of fragmented regions which cannot be separated without losing umbral area. In this way several spots (intensity minima in the umbra) have a common umbra, e.g. -2 means that the given spot shares an umbra with spot No.2, and the common U value is indicated at spot No.2. |
||
| Proj. WS | - Projected whole spot area in millionths of solar disc, negative values indicate | |
|
that several umbras have a common penumbra, e.g. -7 means that the given umbra shares a penumbra with umbra No.7, and the WS value is indicated at No.7. |
||
| Corr. U | - Corrected umbra area in millionths of solar hemisphere, for negative values see above | |
| Corr. WS | - Corrected whole spot area in millionths of solar hemisphere, for negative values see above | |
| B | - Heliographic latitude B; positive: North, negative: South | |
| L | - Heliographic longitude L | |
| LCM | - Longitudinal distance from the Sun's central meridian | |
| Pos. angle | - Position angle | |
| r | - Distance from the centre of Sun's disc in terms of Sun's radius | |
| MU | - Mean magnetic field within the umbra contour averaged the pixel values with sign. | |
| MP | - Mean magnetic field within the penumbra contour averaged the pixel values with sign. | |