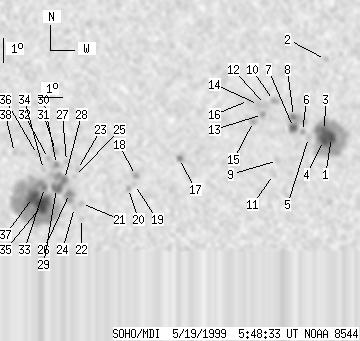
SOHO MDI 1999-05-19 05:48:33 UT
| group | Proj. U | Proj. WS | Corr. U | Corr. WS | B | L | LCM | Pos. angle | r | MU | MP |
| 88 | 659 | 46 | 347 | -20.29 | 118.90 | -3.87 | 170.14 | 0.3282 | 181.1 | 180.7 | |
|
previous
or next observation for the same group /
back to the solar disc SOHO MDI 1999-05-19 05:48:33 UT |
| spot | Proj. U | Proj. WS | Corr. U | Corr. WS | B | L | LCM | Pos. angle | r | MU | MP |
| 10 | 158 | 5 | 82 | -18.92 | 126.65 | 3.89 | 192.62 | 0.2949 | -1782.8 | -701.4 | |
| 0 | 4 | 0 | 2 | -15.74 | 126.34 | 3.58 | 194.45 | 0.2417 | -676.0 | -580.1 | |
| 6 | -1 | 3 | -1 | -18.63 | 126.36 | 3.59 | 191.90 | 0.2892 | -2012.6 | 999999 | |
| 9 | -1 | 5 | -1 | -19.04 | 126.32 | 3.56 | 191.49 | 0.2958 | -1651.3 | 999999 | |
| 0 | 4 | 0 | 2 | -18.92 | 125.70 | 2.93 | 189.59 | 0.2918 | -902.0 | -712.1 | |
| 0 | 4 | 0 | 2 | -18.67 | 125.44 | 2.68 | 188.91 | 0.2871 | -1060.0 | -798.8 | |
| 6 | 37 | 3 | 19 | -18.51 | 125.07 | 2.30 | 187.76 | 0.2835 | -1269.5 | -1033.9 | |
| 2 | -7 | 1 | -7 | -18.06 | 125.06 | 2.30 | 187.97 | 0.2760 | -1482.2 | 999999 | |
| 0 | 5 | 0 | 3 | -19.87 | 124.42 | 1.65 | 185.13 | 0.3048 | 260.0 | 143.1 | |
| 0 | 8 | 0 | 4 | -17.41 | 124.23 | 1.46 | 185.34 | 0.2634 | -1303.0 | -868.7 | |
| 0 | 8 | 0 | 4 | -20.44 | 124.26 | 1.49 | 184.47 | 0.3142 | -785.0 | -611.3 | |
| 0 | 2 | 0 | 1 | -17.57 | 123.90 | 1.14 | 184.10 | 0.2657 | -1094.0 | -1021.2 | |
| 0 | 5 | 0 | 2 | -17.98 | 123.78 | 1.01 | 183.56 | 0.2724 | -1131.0 | -862.0 | |
| 0 | 5 | 0 | 2 | -17.57 | 123.61 | 0.85 | 183.06 | 0.2654 | -1168.0 | -1022.3 | |
| 0 | 5 | 0 | 3 | -18.27 | 123.41 | 0.64 | 182.22 | 0.2769 | -1135.0 | -949.8 | |
| 0 | 4 | 0 | 2 | -17.41 | 123.20 | 0.43 | 181.59 | 0.2624 | -978.0 | -847.2 | |
| 2 | 6 | 1 | 3 | -19.78 | 120.32 | -2.44 | 172.41 | 0.3049 | -1161.0 | -716.3 | |
| 0 | 5 | 0 | 3 | -20.48 | 118.46 | -4.30 | 167.33 | 0.3218 | -1151.0 | -781.9 | |
| 0 | 3 | 0 | 2 | -20.85 | 118.41 | -4.35 | 167.45 | 0.3280 | -566.0 | -513.6 | |
| 0 | 4 | 0 | 2 | -21.02 | 118.15 | -4.61 | 166.86 | 0.3316 | -418.0 | -127.7 | |
| 0 | 3 | 0 | 2 | -21.63 | 116.14 | -6.63 | 162.08 | 0.3502 | 735.0 | 710.2 | |
| 0 | 3 | 0 | 2 | -22.26 | 116.11 | -6.66 | 162.58 | 0.3601 | 633.0 | 573.9 | |
| 0 | 4 | 0 | 2 | -20.22 | 116.03 | -6.73 | 160.37 | 0.3289 | 547.0 | 510.5 | |
| 0 | 3 | 0 | 2 | -21.80 | 115.83 | -6.93 | 161.47 | 0.3543 | 643.0 | 543.9 | |
| 0 | 3 | 0 | 2 | -20.51 | 115.89 | -6.87 | 160.31 | 0.3342 | 505.0 | 425.0 | |
| 3 | 20 | 2 | 11 | -21.22 | 115.65 | -7.12 | 160.43 | 0.3464 | 1318.0 | 984.0 | |
| 0 | 4 | 0 | 2 | -19.89 | 115.58 | -7.18 | 158.79 | 0.3264 | 987.0 | 776.5 | |
| 3 | 323 | 2 | 171 | -20.63 | 115.46 | -7.30 | 159.33 | 0.3385 | 1350.6 | 776.2 | |
| 6 | -28 | 3 | -28 | -21.01 | 115.10 | -7.66 | 158.84 | 0.3462 | 1556.8 | 999999 | |
| 2 | 7 | 1 | 4 | -20.01 | 115.15 | -7.61 | 157.81 | 0.3309 | 1293.5 | 1072.3 | |
| 0 | 7 | 0 | 3 | -19.44 | 115.14 | -7.62 | 157.04 | 0.3222 | 1256.0 | 1112.7 | |
| 0 | 5 | 0 | 3 | -19.76 | 114.83 | -7.94 | 156.65 | 0.3292 | 1061.0 | 758.2 | |
| 3 | -28 | 1 | -28 | -20.96 | 114.60 | -8.17 | 157.53 | 0.3487 | 1546.5 | 999999 | |
| 0 | 4 | 0 | 2 | -20.22 | 114.59 | -8.17 | 156.62 | 0.3375 | 995.0 | 789.1 | |
| 21 | -28 | 11 | -28 | -21.67 | 114.47 | -8.29 | 158.04 | 0.3600 | 1717.9 | 999999 | |
| 0 | 4 | 0 | 2 | -19.60 | 114.37 | -8.39 | 155.25 | 0.3298 | 1051.0 | 923.5 | |
| 15 | -28 | 8 | -28 | -21.37 | 114.06 | -8.70 | 156.73 | 0.3582 | 1734.2 | 999999 | |
| 0 | 2 | 0 | 1 | -19.51 | 113.41 | -9.36 | 152.69 | 0.3355 | 597.0 | 605.0 | |
| Proj. U | - Projected umbra area in millionths of solar disc, negative values indicate | |
|
that the umbra consists of fragmented regions which cannot be separated without losing umbral area. In this way several spots (intensity minima in the umbra) have a common umbra, e.g. -2 means that the given spot shares an umbra with spot No.2, and the common U value is indicated at spot No.2. |
||
| Proj. WS | - Projected whole spot area in millionths of solar disc, negative values indicate | |
|
that several umbras have a common penumbra, e.g. -7 means that the given umbra shares a penumbra with umbra No.7, and the WS value is indicated at No.7. |
||
| Corr. U | - Corrected umbra area in millionths of solar hemisphere, for negative values see above | |
| Corr. WS | - Corrected whole spot area in millionths of solar hemisphere, for negative values see above | |
| B | - Heliographic latitude B; positive: North, negative: South | |
| L | - Heliographic longitude L | |
| LCM | - Longitudinal distance from the Sun's central meridian | |
| Pos. angle | - Position angle | |
| r | - Distance from the centre of Sun's disc in terms of Sun's radius | |
| MU | - Mean magnetic field within the umbra contour averaged the pixel values with sign. | |
| MP | - Mean magnetic field within the penumbra contour averaged the pixel values with sign. | |