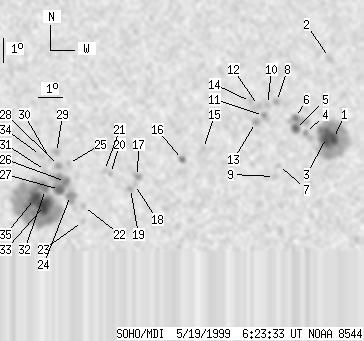
SOHO MDI 1999-05-19 06:23:33 UT
| group | Proj. U | Proj. WS | Corr. U | Corr. WS | B | L | LCM | Pos. angle | r | MU | MP |
| 88 | 661 | 47 | 348 | -20.21 | 119.01 | -3.44 | 171.36 | 0.3259 | 108.8 | 138.1 | |
|
previous
or next observation for the same group /
back to the solar disc SOHO MDI 1999-05-19 06:23:33 UT |
| spot | Proj. U | Proj. WS | Corr. U | Corr. WS | B | L | LCM | Pos. angle | r | MU | MP |
| 9 | 157 | 5 | 81 | -18.91 | 126.66 | 4.22 | 193.66 | 0.2961 | -1795.4 | -670.2 | |
| 0 | 8 | 0 | 4 | -15.62 | 126.42 | 3.98 | 196.15 | 0.2415 | -391.0 | -356.9 | |
| 17 | -1 | 9 | -1 | -18.87 | 126.37 | 3.93 | 192.78 | 0.2944 | -1809.9 | 999999 | |
| 0 | 10 | 0 | 5 | -18.67 | 125.49 | 3.05 | 190.12 | 0.2881 | -994.0 | -714.9 | |
| 5 | 35 | 3 | 18 | -18.51 | 125.08 | 2.63 | 188.85 | 0.2843 | -1382.1 | -1044.2 | |
| 2 | -5 | 1 | -5 | -18.06 | 125.07 | 2.63 | 189.10 | 0.2768 | -1507.8 | 999999 | |
| 0 | 4 | 0 | 2 | -20.03 | 124.39 | 1.95 | 185.97 | 0.3080 | 275.0 | 237.6 | |
| 0 | 5 | 0 | 2 | -17.40 | 124.28 | 1.83 | 186.67 | 0.2641 | -1274.0 | -1051.7 | |
| 0 | 5 | 0 | 2 | -20.48 | 124.23 | 1.78 | 185.33 | 0.3153 | -798.0 | -675.0 | |
| 0 | 3 | 0 | 2 | -17.53 | 123.91 | 1.46 | 185.29 | 0.2655 | -1135.0 | -1014.1 | |
| 0 | 8 | 0 | 4 | -17.98 | 123.75 | 1.30 | 184.57 | 0.2728 | -1172.0 | -728.9 | |
| 0 | 10 | 0 | 5 | -17.57 | 123.54 | 1.09 | 183.94 | 0.2657 | -1042.0 | -899.6 | |
| 0 | 5 | 0 | 3 | -18.26 | 123.42 | 0.97 | 183.35 | 0.2772 | -990.0 | -894.7 | |
| 0 | 5 | 0 | 3 | -17.41 | 123.21 | 0.76 | 182.78 | 0.2626 | -939.0 | -797.3 | |
| 0 | 3 | 0 | 2 | -19.33 | 121.26 | -1.19 | 176.19 | 0.2953 | -873.0 | -723.2 | |
| 3 | 6 | 2 | 3 | -19.78 | 120.38 | -2.07 | 173.57 | 0.3041 | -1023.6 | -697.4 | |
| 0 | 8 | 0 | 4 | -20.48 | 118.48 | -3.97 | 168.29 | 0.3206 | -1321.0 | -869.1 | |
| 0 | 3 | 0 | 2 | -20.81 | 118.34 | -4.10 | 168.13 | 0.3264 | -621.0 | -631.1 | |
| 0 | 6 | 0 | 3 | -20.97 | 118.17 | -4.27 | 167.76 | 0.3297 | -482.0 | -62.0 | |
| 0 | 3 | 0 | 2 | -20.35 | 117.34 | -5.10 | 164.98 | 0.3229 | -523.0 | -339.3 | |
| 0 | 3 | 0 | 2 | -20.23 | 117.10 | -5.35 | 164.17 | 0.3220 | -663.0 | -561.1 | |
| 0 | 4 | 0 | 2 | -21.72 | 116.15 | -6.29 | 163.00 | 0.3499 | 787.0 | 659.4 | |
| 0 | 4 | 0 | 2 | -22.34 | 116.08 | -6.36 | 163.38 | 0.3600 | 768.0 | 620.6 | |
| 4 | 16 | 2 | 8 | -21.26 | 115.62 | -6.83 | 161.21 | 0.3454 | 1343.4 | 985.2 | |
| 0 | 3 | 0 | 2 | -19.93 | 115.59 | -6.85 | 159.73 | 0.3251 | 1090.0 | 829.4 | |
| 4 | 48 | 2 | 25 | -20.67 | 115.43 | -7.01 | 160.13 | 0.3375 | 1379.1 | 1309.3 | |
| 9 | -26 | 5 | -26 | -21.01 | 115.16 | -7.28 | 159.80 | 0.3441 | 1502.6 | 999999 | |
| 0 | 7 | 0 | 4 | -20.01 | 115.17 | -7.27 | 158.69 | 0.3288 | 1294.0 | 1113.7 | |
| 0 | 5 | 0 | 3 | -19.48 | 115.11 | -7.33 | 157.88 | 0.3210 | 1253.0 | 1063.6 | |
| 0 | 3 | 0 | 2 | -19.76 | 114.84 | -7.60 | 157.53 | 0.3271 | 1039.0 | 855.0 | |
| 0 | 5 | 0 | 3 | -20.22 | 114.61 | -7.83 | 157.48 | 0.3354 | 1020.0 | 788.8 | |
| 1 | 270 | 0 | 143 | -21.00 | 114.57 | -7.87 | 158.31 | 0.3475 | 1535.7 | 673.6 | |
| 20 | -32 | 10 | -32 | -21.67 | 114.49 | -7.95 | 158.85 | 0.3580 | 1721.2 | 999999 | |
| 0 | 9 | 0 | 5 | -19.60 | 114.43 | -8.01 | 156.23 | 0.3272 | 983.0 | 827.2 | |
| 14 | -32 | 8 | -32 | -21.37 | 114.08 | -8.36 | 157.54 | 0.3561 | 1725.6 | 999999 | |
| Proj. U | - Projected umbra area in millionths of solar disc, negative values indicate | |
|
that the umbra consists of fragmented regions which cannot be separated without losing umbral area. In this way several spots (intensity minima in the umbra) have a common umbra, e.g. -2 means that the given spot shares an umbra with spot No.2, and the common U value is indicated at spot No.2. |
||
| Proj. WS | - Projected whole spot area in millionths of solar disc, negative values indicate | |
|
that several umbras have a common penumbra, e.g. -7 means that the given umbra shares a penumbra with umbra No.7, and the WS value is indicated at No.7. |
||
| Corr. U | - Corrected umbra area in millionths of solar hemisphere, for negative values see above | |
| Corr. WS | - Corrected whole spot area in millionths of solar hemisphere, for negative values see above | |
| B | - Heliographic latitude B; positive: North, negative: South | |
| L | - Heliographic longitude L | |
| LCM | - Longitudinal distance from the Sun's central meridian | |
| Pos. angle | - Position angle | |
| r | - Distance from the centre of Sun's disc in terms of Sun's radius | |
| MU | - Mean magnetic field within the umbra contour averaged the pixel values with sign. | |
| MP | - Mean magnetic field within the penumbra contour averaged the pixel values with sign. | |