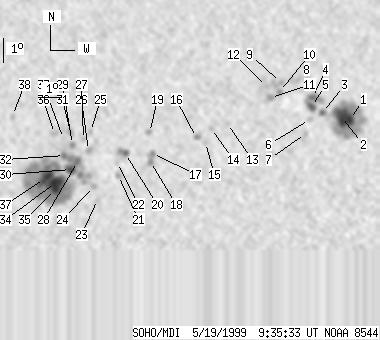
SOHO MDI 1999-05-19 09:35:33 UT
| group | Proj. U | Proj. WS | Corr. U | Corr. WS | B | L | LCM | Pos. angle | r | MU | MP |
| 93 | 707 | 48 | 370 | -20.30 | 118.68 | -2.00 | 175.24 | 0.3247 | 34.6 | 206.5 | |
|
previous
or next observation for the same group /
back to the solar disc SOHO MDI 1999-05-19 09:35:33 UT |
| spot | Proj. U | Proj. WS | Corr. U | Corr. WS | B | L | LCM | Pos. angle | r | MU | MP |
| 7 | 154 | 4 | 80 | -19.01 | 126.78 | 6.10 | 199.19 | 0.3068 | -1737.3 | -628.8 | |
| 22 | -1 | 12 | -1 | -18.89 | 126.44 | 5.76 | 198.34 | 0.3031 | -1837.5 | 999999 | |
| 3 | 7 | 1 | 4 | -18.73 | 125.64 | 4.96 | 196.11 | 0.2966 | -743.3 | -498.9 | |
| 4 | 35 | 2 | 18 | -18.11 | 125.21 | 4.53 | 195.35 | 0.2848 | -1450.3 | -1078.6 | |
| 6 | -4 | 3 | -4 | -18.48 | 125.18 | 4.50 | 194.90 | 0.2906 | -1379.1 | 999999 | |
| 0 | 4 | 0 | 2 | -19.02 | 125.11 | 4.43 | 194.20 | 0.2989 | -840.0 | -610.8 | |
| 0 | 4 | 0 | 2 | -19.59 | 124.96 | 4.28 | 193.26 | 0.3076 | -552.0 | -263.0 | |
| 0 | 10 | 0 | 5 | -17.30 | 124.69 | 4.01 | 194.43 | 0.2694 | -920.0 | -893.4 | |
| 0 | 12 | 0 | 6 | -17.51 | 123.87 | 3.19 | 191.41 | 0.2696 | -1311.0 | -1039.4 | |
| 0 | 4 | 0 | 2 | -17.87 | 123.84 | 3.16 | 191.02 | 0.2756 | -1097.0 | -882.0 | |
| 0 | 8 | 0 | 4 | -18.12 | 123.47 | 2.79 | 189.60 | 0.2785 | -1022.0 | -855.8 | |
| 0 | 3 | 0 | 2 | -17.67 | 123.30 | 2.62 | 189.29 | 0.2706 | -1148.0 | -1037.4 | |
| 0 | 1 | 0 | 1 | -19.19 | 121.70 | 1.02 | 183.29 | 0.2930 | -947.0 | -878.8 | |
| 0 | 4 | 0 | 2 | -19.39 | 121.03 | 0.35 | 181.13 | 0.2960 | -752.0 | -670.6 | |
| 0 | 3 | 0 | 2 | -19.97 | 120.78 | 0.10 | 180.32 | 0.3056 | -807.0 | -645.1 | |
| 0 | 7 | 0 | 4 | -19.76 | 120.41 | -0.27 | 179.14 | 0.3022 | -974.0 | -864.7 | |
| 0 | 7 | 0 | 4 | -20.42 | 118.56 | -2.12 | 173.66 | 0.3151 | -1011.0 | -903.8 | |
| 0 | 4 | 0 | 2 | -20.75 | 118.47 | -2.21 | 173.52 | 0.3208 | -880.0 | -707.2 | |
| 0 | 5 | 0 | 2 | -19.56 | 118.45 | -2.23 | 172.96 | 0.3010 | 749.0 | 786.1 | |
| 3 | 12 | 1 | 6 | -20.42 | 117.43 | -3.25 | 170.32 | 0.3177 | -819.3 | -504.8 | |
| 0 | 10 | 0 | 5 | -21.33 | 117.11 | -3.57 | 169.94 | 0.3335 | 1025.0 | 552.1 | |
| 0 | 3 | 0 | 1 | -20.79 | 117.08 | -3.60 | 169.55 | 0.3248 | 363.0 | 445.5 | |
| 0 | 5 | 0 | 3 | -22.33 | 116.19 | -4.49 | 168.09 | 0.3525 | 788.0 | 468.6 | |
| 0 | 4 | 0 | 2 | -21.79 | 116.04 | -4.64 | 167.34 | 0.3443 | 983.0 | 820.3 | |
| 0 | 4 | 0 | 2 | -19.51 | 115.98 | -4.70 | 165.42 | 0.3080 | 971.0 | 729.1 | |
| 0 | 5 | 0 | 3 | -20.29 | 115.88 | -4.81 | 165.77 | 0.3210 | 590.0 | 728.5 | |
| 0 | 3 | 0 | 2 | -19.84 | 115.68 | -5.00 | 164.82 | 0.3145 | 544.0 | 557.6 | |
| 4 | 89 | 2 | 46 | -20.75 | 115.40 | -5.28 | 164.82 | 0.3302 | 1384.1 | 1084.4 | |
| 0 | 6 | 0 | 3 | -20.04 | 115.21 | -5.47 | 163.67 | 0.3199 | 1226.0 | 1166.0 | |
| 6 | -28 | 3 | -28 | -21.08 | 115.09 | -5.59 | 164.27 | 0.3368 | 1616.0 | 999999 | |
| 0 | 8 | 0 | 4 | -19.51 | 115.15 | -5.53 | 162.97 | 0.3117 | 1333.0 | 1007.3 | |
| 3 | -28 | 2 | -28 | -20.50 | 114.86 | -5.82 | 163.12 | 0.3287 | 1669.1 | 999999 | |
| 0 | 2 | 0 | 1 | -19.79 | 114.84 | -5.84 | 162.39 | 0.3178 | 933.0 | 787.9 | |
| 12 | 274 | 6 | 145 | -21.62 | 114.43 | -6.25 | 163.03 | 0.3483 | 1849.8 | 683.2 | |
| 6 | -34 | 3 | -34 | -21.91 | 114.42 | -6.26 | 163.26 | 0.3530 | 1437.9 | 999999 | |
| 0 | 6 | 0 | 3 | -19.59 | 114.47 | -6.21 | 161.13 | 0.3164 | 1110.0 | 1015.3 | |
| 17 | -34 | 9 | -34 | -21.45 | 113.97 | -6.71 | 161.71 | 0.3480 | 1602.6 | 999999 | |
| 0 | 4 | 0 | 2 | -18.84 | 112.74 | -7.94 | 155.42 | 0.3156 | 1017.0 | 734.5 | |
| Proj. U | - Projected umbra area in millionths of solar disc, negative values indicate | |
|
that the umbra consists of fragmented regions which cannot be separated without losing umbral area. In this way several spots (intensity minima in the umbra) have a common umbra, e.g. -2 means that the given spot shares an umbra with spot No.2, and the common U value is indicated at spot No.2. |
||
| Proj. WS | - Projected whole spot area in millionths of solar disc, negative values indicate | |
|
that several umbras have a common penumbra, e.g. -7 means that the given umbra shares a penumbra with umbra No.7, and the WS value is indicated at No.7. |
||
| Corr. U | - Corrected umbra area in millionths of solar hemisphere, for negative values see above | |
| Corr. WS | - Corrected whole spot area in millionths of solar hemisphere, for negative values see above | |
| B | - Heliographic latitude B; positive: North, negative: South | |
| L | - Heliographic longitude L | |
| LCM | - Longitudinal distance from the Sun's central meridian | |
| Pos. angle | - Position angle | |
| r | - Distance from the centre of Sun's disc in terms of Sun's radius | |
| MU | - Mean magnetic field within the umbra contour averaged the pixel values with sign. | |
| MP | - Mean magnetic field within the penumbra contour averaged the pixel values with sign. | |