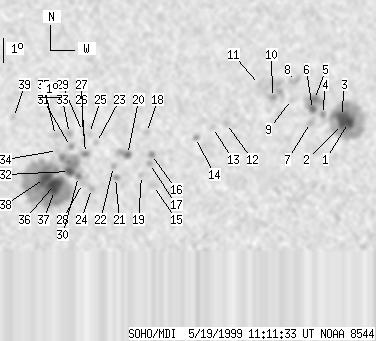
SOHO MDI 1999-05-19 11:11:33 UT
| group | Proj. U | Proj. WS | Corr. U | Corr. WS | B | L | LCM | Pos. angle | r | MU | MP |
| 72 | 740 | 37 | 391 | -20.26 | 119.15 | -0.65 | 179.09 | 0.3229 | 266.9 | 97.7 | |
|
previous
or next observation for the same group /
back to the solar disc SOHO MDI 1999-05-19 11:11:33 UT |
| spot | Proj. U | Proj. WS | Corr. U | Corr. WS | B | L | LCM | Pos. angle | r | MU | MP |
| 6 | 165 | 3 | 86 | -19.09 | 126.78 | 6.98 | 201.61 | 0.3133 | -1820.2 | -717.0 | |
| 6 | -1 | 3 | -1 | -19.17 | 126.53 | 6.73 | 200.82 | 0.3130 | -1616.8 | 999999 | |
| 3 | -1 | 1 | -1 | -18.84 | 126.48 | 6.68 | 201.06 | 0.3077 | -2172.6 | 999999 | |
| 0 | 6 | 0 | 3 | -18.76 | 125.68 | 5.88 | 198.84 | 0.3019 | -999.0 | -716.1 | |
| 5 | 40 | 3 | 21 | -18.15 | 125.33 | 5.53 | 198.46 | 0.2903 | -1483.6 | -1046.0 | |
| 4 | -5 | 2 | -5 | -18.56 | 125.26 | 5.46 | 197.79 | 0.2965 | -1466.3 | 999999 | |
| 0 | 6 | 0 | 3 | -19.09 | 125.19 | 5.39 | 197.03 | 0.3046 | -701.0 | -623.4 | |
| 0 | 9 | 0 | 5 | -17.42 | 124.48 | 4.68 | 196.56 | 0.2744 | -1111.0 | -941.5 | |
| 0 | 1 | 0 | 1 | -18.15 | 124.37 | 4.57 | 195.45 | 0.2857 | -28.0 | -71.7 | |
| 0 | 50 | 0 | 26 | -18.07 | 123.58 | 3.78 | 192.95 | 0.2812 | -1241.0 | -874.8 | |
| 0 | 4 | 0 | 2 | -17.54 | 123.04 | 3.24 | 191.53 | 0.2705 | -944.0 | -769.3 | |
| 0 | 6 | 0 | 3 | -19.14 | 121.69 | 1.89 | 186.13 | 0.2936 | -925.0 | -688.7 | |
| 0 | 4 | 0 | 2 | -19.31 | 121.11 | 1.31 | 184.21 | 0.2955 | -604.0 | -462.2 | |
| 0 | 6 | 0 | 3 | -19.72 | 120.40 | 0.60 | 181.89 | 0.3017 | -780.0 | -792.0 | |
| 0 | 7 | 0 | 4 | -21.71 | 118.64 | -1.16 | 176.76 | 0.3352 | -783.0 | -480.4 | |
| 2 | 8 | 1 | 4 | -20.42 | 118.56 | -1.24 | 176.29 | 0.3139 | -1078.6 | -833.1 | |
| 0 | 4 | 0 | 2 | -20.79 | 118.47 | -1.32 | 176.11 | 0.3202 | -979.0 | -812.6 | |
| 0 | 5 | 0 | 3 | -19.51 | 118.36 | -1.44 | 175.44 | 0.2991 | 957.0 | 686.6 | |
| 0 | 4 | 0 | 2 | -21.29 | 118.13 | -1.67 | 175.25 | 0.3289 | 844.0 | 503.5 | |
| 4 | 15 | 2 | 8 | -20.42 | 117.55 | -2.24 | 173.29 | 0.3154 | -890.2 | -739.3 | |
| 0 | 5 | 0 | 3 | -21.37 | 117.03 | -2.77 | 172.19 | 0.3322 | 1150.0 | 833.3 | |
| 0 | 4 | 0 | 2 | -20.92 | 116.96 | -2.84 | 171.77 | 0.3249 | 742.0 | 581.1 | |
| 0 | 4 | 0 | 2 | -19.92 | 116.26 | -3.53 | 169.19 | 0.3105 | -450.0 | -265.2 | |
| 0 | 6 | 0 | 3 | -21.83 | 116.01 | -3.79 | 169.62 | 0.3423 | 839.0 | 806.1 | |
| 0 | 3 | 0 | 2 | -19.55 | 115.98 | -3.82 | 168.09 | 0.3054 | 692.0 | 724.9 | |
| 3 | 7 | 1 | 4 | -20.37 | 115.79 | -4.01 | 168.11 | 0.3194 | 1080.8 | 832.7 | |
| 0 | 3 | 0 | 2 | -19.84 | 115.72 | -4.08 | 167.52 | 0.3110 | 724.0 | 546.4 | |
| 0 | 12 | 0 | 7 | -21.62 | 115.63 | -4.17 | 168.49 | 0.3401 | 890.0 | 765.2 | |
| 0 | 2 | 0 | 1 | -19.47 | 115.69 | -4.11 | 167.15 | 0.3051 | 845.0 | 737.4 | |
| 3 | 69 | 2 | 36 | -21.33 | 115.47 | -4.33 | 167.86 | 0.3359 | 1144.1 | 1233.5 | |
| 0 | 5 | 0 | 3 | -20.08 | 115.17 | -4.63 | 166.11 | 0.3170 | 1225.0 | 1038.2 | |
| 6 | -30 | 3 | -30 | -21.12 | 115.10 | -4.70 | 166.70 | 0.3339 | 1633.1 | 999999 | |
| 0 | 5 | 0 | 3 | -19.55 | 115.14 | -4.66 | 165.58 | 0.3085 | 1124.0 | 1063.1 | |
| 0 | 5 | 0 | 2 | -20.25 | 114.62 | -5.18 | 164.68 | 0.3220 | 969.0 | 826.2 | |
| 0 | 5 | 0 | 3 | -19.63 | 114.56 | -5.24 | 163.93 | 0.3124 | 1225.0 | 929.2 | |
| 12 | 262 | 6 | 138 | -21.66 | 114.44 | -5.36 | 165.37 | 0.3451 | 1862.3 | 713.3 | |
| 5 | -36 | 3 | -36 | -21.91 | 114.43 | -5.37 | 165.54 | 0.3491 | 1495.9 | 999999 | |
| 13 | -36 | 7 | -36 | -21.41 | 114.03 | -5.77 | 164.08 | 0.3430 | 1746.4 | 999999 | |
| 0 | 3 | 0 | 2 | -18.88 | 112.82 | -6.97 | 158.15 | 0.3101 | 706.0 | 784.5 | |
| Proj. U | - Projected umbra area in millionths of solar disc, negative values indicate | |
|
that the umbra consists of fragmented regions which cannot be separated without losing umbral area. In this way several spots (intensity minima in the umbra) have a common umbra, e.g. -2 means that the given spot shares an umbra with spot No.2, and the common U value is indicated at spot No.2. |
||
| Proj. WS | - Projected whole spot area in millionths of solar disc, negative values indicate | |
|
that several umbras have a common penumbra, e.g. -7 means that the given umbra shares a penumbra with umbra No.7, and the WS value is indicated at No.7. |
||
| Corr. U | - Corrected umbra area in millionths of solar hemisphere, for negative values see above | |
| Corr. WS | - Corrected whole spot area in millionths of solar hemisphere, for negative values see above | |
| B | - Heliographic latitude B; positive: North, negative: South | |
| L | - Heliographic longitude L | |
| LCM | - Longitudinal distance from the Sun's central meridian | |
| Pos. angle | - Position angle | |
| r | - Distance from the centre of Sun's disc in terms of Sun's radius | |
| MU | - Mean magnetic field within the umbra contour averaged the pixel values with sign. | |
| MP | - Mean magnetic field within the penumbra contour averaged the pixel values with sign. | |