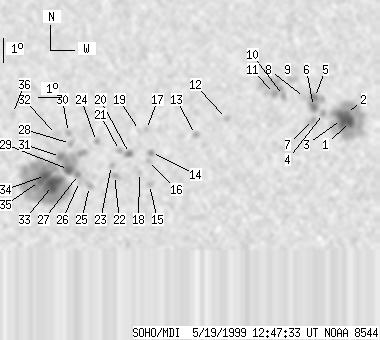
SOHO MDI 1999-05-19 12:47:33 UT
| group | Proj. U | Proj. WS | Corr. U | Corr. WS | B | L | LCM | Pos. angle | r | MU | MP |
| 86 | 744 | 46 | 391 | -20.25 | 119.12 | 0.21 | 181.51 | 0.3234 | 107.3 | 83.4 | |
|
previous
or next observation for the same group /
back to the solar disc SOHO MDI 1999-05-19 12:47:33 UT |
| spot | Proj. U | Proj. WS | Corr. U | Corr. WS | B | L | LCM | Pos. angle | r | MU | MP |
| 9 | 160 | 5 | 83 | -19.11 | 126.91 | 7.99 | 204.31 | 0.3204 | -1641.9 | -654.1 | |
| 3 | -1 | 2 | -1 | -18.79 | 126.72 | 7.81 | 204.27 | 0.3142 | -1867.6 | 999999 | |
| 12 | -1 | 6 | -1 | -19.03 | 126.53 | 7.61 | 203.39 | 0.3166 | -1816.9 | 999999 | |
| 0 | 5 | 0 | 3 | -18.79 | 125.76 | 6.84 | 201.58 | 0.3080 | -1054.0 | -715.4 | |
| 4 | 37 | 2 | 19 | -18.14 | 125.36 | 6.44 | 201.25 | 0.2955 | -1460.6 | -1078.9 | |
| 5 | -5 | 3 | -5 | -18.51 | 125.33 | 6.41 | 200.70 | 0.3010 | -1405.6 | 999999 | |
| 0 | 11 | 0 | 6 | -19.04 | 125.35 | 6.43 | 200.11 | 0.3094 | -1128.0 | -713.0 | |
| 0 | 5 | 0 | 2 | -18.14 | 124.94 | 6.03 | 199.99 | 0.2931 | -878.0 | -498.3 | |
| 0 | 7 | 0 | 4 | -17.41 | 124.34 | 5.42 | 199.00 | 0.2782 | -1088.0 | -920.6 | |
| 0 | 5 | 0 | 3 | -18.06 | 124.07 | 5.15 | 197.38 | 0.2871 | -1003.0 | -629.8 | |
| 0 | 58 | 0 | 30 | -17.98 | 123.69 | 4.78 | 196.26 | 0.2840 | -1227.0 | -1008.5 | |
| 0 | 4 | 0 | 2 | -19.01 | 121.72 | 2.81 | 189.11 | 0.2936 | -1003.0 | -777.2 | |
| 0 | 4 | 0 | 2 | -19.67 | 120.44 | 1.52 | 184.77 | 0.3019 | -1031.0 | -834.2 | |
| 0 | 7 | 0 | 4 | -20.41 | 118.60 | -0.32 | 179.05 | 0.3133 | -1113.0 | -917.6 | |
| 0 | 4 | 0 | 2 | -21.74 | 118.51 | -0.40 | 178.88 | 0.3354 | -764.0 | -673.0 | |
| 0 | 3 | 0 | 2 | -20.74 | 118.47 | -0.44 | 178.70 | 0.3189 | -978.0 | -834.6 | |
| 0 | 4 | 0 | 2 | -19.46 | 118.40 | -0.52 | 178.34 | 0.2976 | 461.0 | 387.4 | |
| 0 | 4 | 0 | 2 | -21.24 | 118.09 | -0.82 | 177.64 | 0.3273 | 706.0 | 484.9 | |
| 0 | 2 | 0 | 1 | -19.51 | 118.10 | -0.81 | 177.42 | 0.2984 | 595.0 | 522.0 | |
| 3 | 8 | 2 | 4 | -20.45 | 117.68 | -1.24 | 176.29 | 0.3146 | -1054.8 | -722.0 | |
| 0 | 5 | 0 | 3 | -20.33 | 117.26 | -1.66 | 175.01 | 0.3131 | -909.0 | -880.1 | |
| 0 | 7 | 0 | 4 | -21.37 | 117.04 | -1.88 | 174.67 | 0.3306 | 1141.0 | 743.2 | |
| 0 | 4 | 0 | 2 | -20.95 | 116.92 | -2.00 | 174.20 | 0.3239 | 849.0 | 674.0 | |
| 0 | 5 | 0 | 3 | -19.96 | 116.30 | -2.62 | 171.98 | 0.3087 | -524.0 | -392.1 | |
| 0 | 7 | 0 | 4 | -21.82 | 115.97 | -2.95 | 171.90 | 0.3401 | 904.0 | 766.5 | |
| 0 | 8 | 0 | 4 | -21.61 | 115.55 | -3.36 | 170.66 | 0.3377 | 872.0 | 745.0 | |
| 3 | 358 | 1 | 188 | -21.32 | 115.52 | -3.40 | 170.41 | 0.3331 | 1159.7 | 776.4 | |
| 0 | 4 | 0 | 2 | -20.04 | 115.21 | -3.71 | 168.77 | 0.3131 | 1217.0 | 972.5 | |
| 7 | -27 | 4 | -27 | -21.11 | 115.10 | -3.82 | 169.14 | 0.3309 | 1636.6 | 999999 | |
| 0 | 4 | 0 | 2 | -19.58 | 115.14 | -3.78 | 168.24 | 0.3059 | 1277.0 | 1121.7 | |
| 3 | -27 | 2 | -27 | -20.57 | 114.78 | -4.14 | 167.88 | 0.3233 | 1606.4 | 999999 | |
| 0 | 7 | 0 | 4 | -19.66 | 114.63 | -4.28 | 166.79 | 0.3091 | 1073.0 | 845.9 | |
| 26 | -27 | 13 | -27 | -21.78 | 114.40 | -4.51 | 167.68 | 0.3440 | 1619.7 | 999999 | |
| 8 | -27 | 4 | -27 | -21.36 | 114.12 | -4.80 | 166.63 | 0.3383 | 1923.0 | 999999 | |
| 3 | -27 | 2 | -27 | -21.61 | 113.86 | -5.06 | 166.12 | 0.3433 | 1376.5 | 999999 | |
| 0 | 7 | 0 | 4 | -18.80 | 112.82 | -6.09 | 160.58 | 0.3037 | 790.0 | 573.9 | |
| Proj. U | - Projected umbra area in millionths of solar disc, negative values indicate | |
|
that the umbra consists of fragmented regions which cannot be separated without losing umbral area. In this way several spots (intensity minima in the umbra) have a common umbra, e.g. -2 means that the given spot shares an umbra with spot No.2, and the common U value is indicated at spot No.2. |
||
| Proj. WS | - Projected whole spot area in millionths of solar disc, negative values indicate | |
|
that several umbras have a common penumbra, e.g. -7 means that the given umbra shares a penumbra with umbra No.7, and the WS value is indicated at No.7. |
||
| Corr. U | - Corrected umbra area in millionths of solar hemisphere, for negative values see above | |
| Corr. WS | - Corrected whole spot area in millionths of solar hemisphere, for negative values see above | |
| B | - Heliographic latitude B; positive: North, negative: South | |
| L | - Heliographic longitude L | |
| LCM | - Longitudinal distance from the Sun's central meridian | |
| Pos. angle | - Position angle | |
| r | - Distance from the centre of Sun's disc in terms of Sun's radius | |
| MU | - Mean magnetic field within the umbra contour averaged the pixel values with sign. | |
| MP | - Mean magnetic field within the penumbra contour averaged the pixel values with sign. | |