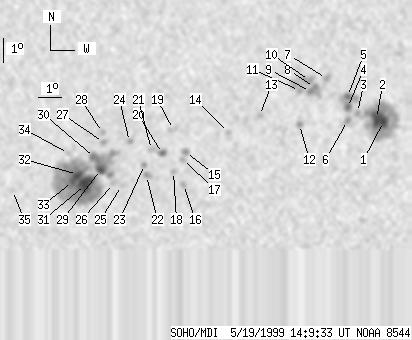
SOHO MDI 1999-05-19 14:09:33 UT
| group | Proj. U | Proj. WS | Corr. U | Corr. WS | B | L | LCM | Pos. angle | r | MU | MP |
| 80 | 725 | 41 | 380 | -20.32 | 119.01 | 0.85 | 183.33 | 0.3249 | 10.1 | 110.0 | |
|
previous
or next observation for the same group /
back to the solar disc SOHO MDI 1999-05-19 14:09:33 UT |
| spot | Proj. U | Proj. WS | Corr. U | Corr. WS | B | L | LCM | Pos. angle | r | MU | MP |
| 9 | 150 | 5 | 78 | -19.14 | 126.91 | 8.75 | 206.26 | 0.3263 | -1672.0 | -660.7 | |
| 14 | -1 | 7 | -1 | -19.02 | 126.61 | 8.45 | 205.65 | 0.3223 | -1885.3 | 999999 | |
| 0 | 8 | 0 | 4 | -18.78 | 125.80 | 7.64 | 203.82 | 0.3131 | -798.0 | -688.2 | |
| 4 | 40 | 2 | 21 | -18.58 | 125.38 | 7.21 | 202.90 | 0.3072 | -1404.1 | -1047.6 | |
| 4 | -4 | 2 | -4 | -18.13 | 125.36 | 7.19 | 203.46 | 0.3002 | -1520.2 | 999999 | |
| 0 | 6 | 0 | 3 | -19.11 | 125.40 | 7.24 | 202.27 | 0.3155 | -1123.0 | -835.4 | |
| 0 | 6 | 0 | 3 | -17.40 | 124.46 | 6.29 | 201.78 | 0.2832 | -1185.0 | -971.2 | |
| 2 | 21 | 1 | 11 | -17.77 | 123.97 | 5.81 | 199.78 | 0.2861 | -1327.6 | -926.3 | |
| 2 | -8 | 1 | -8 | -17.93 | 123.81 | 5.65 | 199.08 | 0.2878 | -1214.0 | 999999 | |
| 0 | 12 | 0 | 6 | -17.48 | 123.76 | 5.59 | 199.45 | 0.2804 | -1473.0 | -1202.3 | |
| 0 | 27 | 0 | 14 | -17.89 | 123.35 | 5.19 | 197.68 | 0.2847 | -1087.0 | -939.3 | |
| 0 | 6 | 0 | 3 | -19.28 | 123.40 | 5.23 | 196.35 | 0.3071 | 781.0 | 624.9 | |
| 0 | 5 | 0 | 2 | -18.92 | 121.72 | 3.55 | 191.54 | 0.2944 | -915.0 | -763.8 | |
| 0 | 4 | 0 | 2 | -19.62 | 120.44 | 2.27 | 187.13 | 0.3025 | -1026.0 | -889.3 | |
| 0 | 6 | 0 | 3 | -20.45 | 118.65 | 0.48 | 181.45 | 0.3141 | -1085.0 | -925.5 | |
| 0 | 5 | 0 | 3 | -21.78 | 118.57 | 0.40 | 181.12 | 0.3361 | -815.0 | -661.4 | |
| 0 | 3 | 0 | 2 | -20.74 | 118.52 | 0.36 | 181.05 | 0.3189 | -876.0 | -715.4 | |
| 0 | 4 | 0 | 2 | -21.24 | 118.14 | -0.02 | 179.94 | 0.3271 | 557.0 | 440.0 | |
| 0 | 9 | 0 | 5 | -19.50 | 118.14 | -0.02 | 179.94 | 0.2981 | 396.0 | 431.5 | |
| 3 | 8 | 2 | 4 | -20.49 | 117.68 | -0.48 | 178.56 | 0.3148 | -1091.8 | -698.9 | |
| 0 | 8 | 0 | 4 | -20.32 | 117.22 | -0.94 | 177.16 | 0.3123 | -965.0 | -781.6 | |
| 0 | 7 | 0 | 4 | -21.40 | 117.00 | -1.16 | 176.71 | 0.3304 | 1109.0 | 669.8 | |
| 0 | 7 | 0 | 3 | -20.94 | 116.92 | -1.24 | 176.39 | 0.3229 | 799.0 | 552.8 | |
| 0 | 4 | 0 | 2 | -19.99 | 116.30 | -1.86 | 174.29 | 0.3079 | -524.0 | -682.3 | |
| 0 | 3 | 0 | 2 | -21.82 | 115.94 | -2.22 | 173.87 | 0.3386 | 1011.0 | 807.2 | |
| 0 | 5 | 0 | 3 | -21.73 | 115.61 | -2.56 | 172.92 | 0.3379 | 770.0 | 787.5 | |
| 0 | 4 | 0 | 2 | -20.03 | 115.22 | -2.95 | 171.01 | 0.3109 | 1189.0 | 1012.9 | |
| 0 | 3 | 0 | 2 | -19.62 | 115.18 | -2.98 | 170.68 | 0.3042 | 1157.0 | 1144.7 | |
| 5 | 359 | 2 | 189 | -21.15 | 115.07 | -3.10 | 171.16 | 0.3296 | 1629.0 | 797.6 | |
| 4 | -29 | 2 | -29 | -20.65 | 114.82 | -3.34 | 170.21 | 0.3221 | 1771.0 | 999999 | |
| 21 | -29 | 11 | -29 | -21.77 | 114.42 | -3.75 | 169.72 | 0.3415 | 1702.7 | 999999 | |
| 8 | -29 | 4 | -29 | -21.36 | 114.09 | -4.07 | 168.58 | 0.3358 | 1971.4 | 999999 | |
| 4 | -29 | 2 | -29 | -21.65 | 113.87 | -4.30 | 168.18 | 0.3412 | 1338.7 | 999999 | |
| 0 | 4 | 0 | 2 | -20.48 | 113.74 | -4.43 | 167.00 | 0.3229 | 729.0 | 592.6 | |
| 0 | 1 | 0 | 1 | -22.01 | 111.30 | -6.86 | 161.89 | 0.3579 | 56.0 | 40.3 | |
| Proj. U | - Projected umbra area in millionths of solar disc, negative values indicate | |
|
that the umbra consists of fragmented regions which cannot be separated without losing umbral area. In this way several spots (intensity minima in the umbra) have a common umbra, e.g. -2 means that the given spot shares an umbra with spot No.2, and the common U value is indicated at spot No.2. |
||
| Proj. WS | - Projected whole spot area in millionths of solar disc, negative values indicate | |
|
that several umbras have a common penumbra, e.g. -7 means that the given umbra shares a penumbra with umbra No.7, and the WS value is indicated at No.7. |
||
| Corr. U | - Corrected umbra area in millionths of solar hemisphere, for negative values see above | |
| Corr. WS | - Corrected whole spot area in millionths of solar hemisphere, for negative values see above | |
| B | - Heliographic latitude B; positive: North, negative: South | |
| L | - Heliographic longitude L | |
| LCM | - Longitudinal distance from the Sun's central meridian | |
| Pos. angle | - Position angle | |
| r | - Distance from the centre of Sun's disc in terms of Sun's radius | |
| MU | - Mean magnetic field within the umbra contour averaged the pixel values with sign. | |
| MP | - Mean magnetic field within the penumbra contour averaged the pixel values with sign. | |