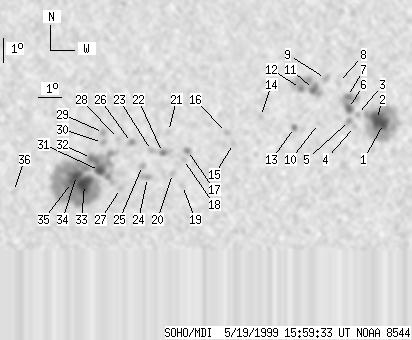
SOHO MDI 1999-05-19 15:59:33 UT
| group | Proj. U | Proj. WS | Corr. U | Corr. WS | B | L | LCM | Pos. angle | r | MU | MP |
| 95 | 732 | 50 | 382 | -20.34 | 119.08 | 1.92 | 186.27 | 0.3267 | -7.0 | 109.4 | |
|
previous
or next observation for the same group /
back to the solar disc SOHO MDI 1999-05-19 15:59:33 UT |
| spot | Proj. U | Proj. WS | Corr. U | Corr. WS | B | L | LCM | Pos. angle | r | MU | MP |
| 10 | 145 | 5 | 76 | -19.21 | 126.96 | 9.81 | 208.79 | 0.3354 | -1584.1 | -615.9 | |
| 15 | -1 | 8 | -1 | -19.05 | 126.66 | 9.50 | 208.29 | 0.3307 | -1878.0 | 999999 | |
| 0 | 3 | 0 | 2 | -18.85 | 125.85 | 8.69 | 206.53 | 0.3216 | -1105.0 | -856.1 | |
| 0 | 4 | 0 | 2 | -19.34 | 125.75 | 8.59 | 205.56 | 0.3282 | -864.0 | -671.8 | |
| 0 | 10 | 0 | 5 | -19.10 | 125.52 | 8.37 | 205.32 | 0.3229 | -1184.0 | -865.2 | |
| 5 | 37 | 3 | 19 | -18.60 | 125.46 | 8.30 | 205.85 | 0.3152 | -1389.0 | -1067.6 | |
| 3 | -6 | 2 | -6 | -18.11 | 125.39 | 8.24 | 206.41 | 0.3075 | -1352.8 | 999999 | |
| 0 | 4 | 0 | 2 | -17.54 | 124.99 | 7.83 | 206.16 | 0.2961 | -419.0 | -573.0 | |
| 0 | 7 | 0 | 3 | -17.38 | 124.44 | 7.29 | 204.82 | 0.2897 | -1023.0 | -957.1 | |
| 0 | 2 | 0 | 1 | -19.23 | 124.23 | 7.07 | 201.66 | 0.3163 | -623.0 | -479.0 | |
| 5 | 58 | 3 | 30 | -17.83 | 123.96 | 6.81 | 202.73 | 0.2933 | -1457.2 | -1116.9 | |
| 2 | -11 | 1 | -11 | -17.79 | 123.42 | 6.26 | 201.14 | 0.2893 | -1134.2 | 999999 | |
| 3 | 6 | 1 | 3 | -19.39 | 123.23 | 6.07 | 198.67 | 0.3132 | 812.3 | 797.7 | |
| 0 | 4 | 0 | 2 | -18.95 | 121.79 | 4.64 | 194.88 | 0.2992 | -818.0 | -715.9 | |
| 0 | 5 | 0 | 2 | -20.06 | 120.69 | 3.54 | 190.71 | 0.3132 | -924.0 | -525.8 | |
| 0 | 4 | 0 | 2 | -19.61 | 120.39 | 3.23 | 190.09 | 0.3049 | -836.0 | -786.7 | |
| 2 | 7 | 1 | 4 | -20.35 | 118.77 | 1.61 | 184.85 | 0.3137 | -1205.4 | -850.5 | |
| 0 | 4 | 0 | 2 | -20.73 | 118.60 | 1.45 | 184.26 | 0.3197 | -877.0 | -667.8 | |
| 0 | 4 | 0 | 2 | -21.81 | 118.57 | 1.42 | 183.92 | 0.3375 | -909.0 | -680.0 | |
| 0 | 5 | 0 | 3 | -21.31 | 118.15 | 0.99 | 182.82 | 0.3288 | 533.0 | 473.3 | |
| 0 | 4 | 0 | 2 | -19.57 | 117.97 | 0.81 | 182.57 | 0.2998 | 724.0 | 473.0 | |
| 3 | 10 | 2 | 5 | -20.44 | 117.72 | 0.57 | 181.70 | 0.3141 | -999.5 | -838.2 | |
| 0 | 7 | 0 | 4 | -20.35 | 117.26 | 0.10 | 180.32 | 0.3126 | -901.0 | -722.3 | |
| 0 | 10 | 0 | 5 | -21.48 | 117.09 | -0.06 | 179.82 | 0.3312 | 946.0 | 794.7 | |
| 0 | 5 | 0 | 3 | -20.98 | 116.88 | -0.27 | 179.20 | 0.3229 | 691.0 | 681.8 | |
| 0 | 7 | 0 | 4 | -20.02 | 116.42 | -0.73 | 177.75 | 0.3073 | -1194.0 | -669.6 | |
| 0 | 6 | 0 | 3 | -21.93 | 115.95 | -1.21 | 176.68 | 0.3393 | 792.0 | 720.8 | |
| 0 | 4 | 0 | 2 | -19.86 | 115.88 | -1.27 | 176.05 | 0.3050 | 682.0 | 614.2 | |
| 0 | 4 | 0 | 2 | -19.61 | 115.26 | -1.90 | 174.04 | 0.3018 | 1296.0 | 1086.0 | |
| 0 | 6 | 0 | 3 | -20.02 | 115.21 | -1.95 | 174.04 | 0.3087 | 1114.0 | 852.3 | |
| 10 | 355 | 5 | 186 | -21.18 | 115.07 | -2.09 | 174.03 | 0.3281 | 1595.4 | 809.1 | |
| 3 | -31 | 1 | -31 | -20.68 | 114.74 | -2.42 | 172.90 | 0.3205 | 1783.2 | 999999 | |
| 23 | -31 | 12 | -31 | -21.76 | 114.42 | -2.73 | 172.47 | 0.3389 | 1747.9 | 999999 | |
| 7 | -31 | 4 | -31 | -21.39 | 114.09 | -3.06 | 171.39 | 0.3336 | 2003.6 | 999999 | |
| 4 | -31 | 2 | -31 | -21.68 | 113.88 | -3.28 | 170.93 | 0.3389 | 1400.9 | 999999 | |
| 0 | 5 | 0 | 3 | -22.05 | 111.40 | -5.76 | 164.68 | 0.3534 | 560.0 | 297.2 | |
| Proj. U | - Projected umbra area in millionths of solar disc, negative values indicate | |
|
that the umbra consists of fragmented regions which cannot be separated without losing umbral area. In this way several spots (intensity minima in the umbra) have a common umbra, e.g. -2 means that the given spot shares an umbra with spot No.2, and the common U value is indicated at spot No.2. |
||
| Proj. WS | - Projected whole spot area in millionths of solar disc, negative values indicate | |
|
that several umbras have a common penumbra, e.g. -7 means that the given umbra shares a penumbra with umbra No.7, and the WS value is indicated at No.7. |
||
| Corr. U | - Corrected umbra area in millionths of solar hemisphere, for negative values see above | |
| Corr. WS | - Corrected whole spot area in millionths of solar hemisphere, for negative values see above | |
| B | - Heliographic latitude B; positive: North, negative: South | |
| L | - Heliographic longitude L | |
| LCM | - Longitudinal distance from the Sun's central meridian | |
| Pos. angle | - Position angle | |
| r | - Distance from the centre of Sun's disc in terms of Sun's radius | |
| MU | - Mean magnetic field within the umbra contour averaged the pixel values with sign. | |
| MP | - Mean magnetic field within the penumbra contour averaged the pixel values with sign. | |