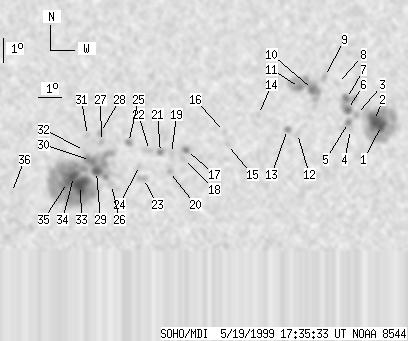
SOHO MDI 1999-05-19 17:35:33 UT
| group | Proj. U | Proj. WS | Corr. U | Corr. WS | B | L | LCM | Pos. angle | r | MU | MP |
| 103 | 743 | 52 | 391 | -20.29 | 119.20 | 2.93 | 189.06 | 0.3283 | -9.4 | 126.0 | |
|
previous
or next observation for the same group /
back to the solar disc SOHO MDI 1999-05-19 17:35:33 UT |
| spot | Proj. U | Proj. WS | Corr. U | Corr. WS | B | L | LCM | Pos. angle | r | MU | MP |
| 8 | 147 | 4 | 78 | -19.28 | 127.02 | 10.74 | 210.89 | 0.3442 | -1495.6 | -594.9 | |
| 15 | -1 | 8 | -1 | -19.08 | 126.71 | 10.43 | 210.49 | 0.3388 | -1919.4 | 999999 | |
| 0 | 5 | 0 | 2 | -18.84 | 125.93 | 9.66 | 208.99 | 0.3290 | -942.0 | -752.8 | |
| 0 | 3 | 0 | 1 | -19.45 | 125.72 | 9.44 | 207.52 | 0.3362 | -640.0 | -639.7 | |
| 3 | 9 | 2 | 5 | -19.17 | 125.61 | 9.34 | 207.70 | 0.3313 | -1060.0 | -787.9 | |
| 5 | 37 | 3 | 19 | -18.63 | 125.54 | 9.27 | 208.33 | 0.3230 | -1295.7 | -1048.0 | |
| 4 | -6 | 2 | -6 | -18.18 | 125.48 | 9.20 | 208.87 | 0.3161 | -1480.2 | 999999 | |
| 0 | 5 | 0 | 3 | -17.57 | 125.07 | 8.79 | 208.79 | 0.3040 | -938.0 | -672.5 | |
| 0 | 6 | 0 | 3 | -17.29 | 124.51 | 8.24 | 207.71 | 0.2955 | -1082.0 | -886.9 | |
| 6 | 67 | 3 | 35 | -17.82 | 124.04 | 7.76 | 205.52 | 0.2998 | -1381.0 | -1109.0 | |
| 4 | -10 | 2 | -10 | -17.74 | 123.49 | 7.22 | 204.06 | 0.2948 | -1183.0 | 999999 | |
| 0 | 7 | 0 | 4 | -19.63 | 123.49 | 7.22 | 201.55 | 0.3235 | 822.0 | 419.7 | |
| 3 | 6 | 1 | 3 | -19.47 | 123.06 | 6.79 | 200.58 | 0.3185 | 1118.3 | 563.6 | |
| 0 | 3 | 0 | 2 | -18.86 | 121.83 | 5.55 | 197.72 | 0.3021 | -1091.0 | -907.3 | |
| 0 | 3 | 0 | 2 | -20.09 | 120.57 | 4.29 | 192.89 | 0.3164 | -566.0 | -460.8 | |
| 0 | 4 | 0 | 2 | -19.56 | 120.43 | 4.15 | 192.89 | 0.3073 | -831.0 | -624.1 | |
| 3 | 9 | 2 | 5 | -20.35 | 118.85 | 2.58 | 187.72 | 0.3155 | -1125.7 | -702.8 | |
| 0 | 4 | 0 | 2 | -20.68 | 118.73 | 2.46 | 187.22 | 0.3207 | -705.0 | -583.7 | |
| 0 | 6 | 0 | 3 | -20.47 | 118.22 | 1.95 | 185.81 | 0.3163 | -886.0 | -569.5 | |
| 0 | 3 | 0 | 2 | -21.22 | 118.15 | 1.88 | 185.35 | 0.3285 | 580.0 | 489.0 | |
| 3 | 7 | 1 | 4 | -20.43 | 117.76 | 1.49 | 184.45 | 0.3149 | -901.8 | -832.0 | |
| 0 | 8 | 0 | 4 | -20.35 | 117.30 | 1.03 | 183.09 | 0.3131 | -830.0 | -661.8 | |
| 0 | 9 | 0 | 5 | -21.51 | 117.05 | 0.78 | 182.20 | 0.3321 | 566.0 | 698.7 | |
| 0 | 5 | 0 | 3 | -20.97 | 116.88 | 0.61 | 181.77 | 0.3231 | 571.0 | 546.1 | |
| 3 | 6 | 1 | 3 | -20.02 | 116.42 | 0.15 | 180.45 | 0.3071 | -873.0 | -614.2 | |
| 0 | 7 | 0 | 4 | -21.76 | 115.70 | -0.57 | 178.41 | 0.3362 | 816.0 | 753.1 | |
| 0 | 4 | 0 | 2 | -19.98 | 115.29 | -0.98 | 176.97 | 0.3068 | 1124.0 | 921.1 | |
| 0 | 4 | 0 | 2 | -19.60 | 115.25 | -1.02 | 176.78 | 0.3007 | 1032.0 | 990.7 | |
| 7 | 363 | 3 | 190 | -21.22 | 115.07 | -1.20 | 176.56 | 0.3277 | 1550.4 | 823.7 | |
| 6 | -29 | 3 | -29 | -20.76 | 114.82 | -1.45 | 175.74 | 0.3204 | 1823.9 | 999999 | |
| 0 | 3 | 0 | 1 | -19.73 | 114.71 | -1.57 | 175.11 | 0.3034 | 943.0 | 826.9 | |
| 0 | 1 | 0 | 1 | -20.35 | 114.58 | -1.70 | 174.90 | 0.3138 | 985.0 | 985.0 | |
| 21 | -29 | 11 | -29 | -21.80 | 114.39 | -1.88 | 174.80 | 0.3381 | 1724.1 | 999999 | |
| 8 | -29 | 4 | -29 | -21.43 | 114.10 | -2.18 | 173.87 | 0.3324 | 1991.9 | 999999 | |
| 4 | -29 | 2 | -29 | -21.68 | 113.84 | -2.43 | 173.25 | 0.3370 | 1448.2 | 999999 | |
| 0 | 2 | 0 | 1 | -22.09 | 111.45 | -4.82 | 167.10 | 0.3504 | 167.0 | 215.0 | |
| Proj. U | - Projected umbra area in millionths of solar disc, negative values indicate | |
|
that the umbra consists of fragmented regions which cannot be separated without losing umbral area. In this way several spots (intensity minima in the umbra) have a common umbra, e.g. -2 means that the given spot shares an umbra with spot No.2, and the common U value is indicated at spot No.2. |
||
| Proj. WS | - Projected whole spot area in millionths of solar disc, negative values indicate | |
|
that several umbras have a common penumbra, e.g. -7 means that the given umbra shares a penumbra with umbra No.7, and the WS value is indicated at No.7. |
||
| Corr. U | - Corrected umbra area in millionths of solar hemisphere, for negative values see above | |
| Corr. WS | - Corrected whole spot area in millionths of solar hemisphere, for negative values see above | |
| B | - Heliographic latitude B; positive: North, negative: South | |
| L | - Heliographic longitude L | |
| LCM | - Longitudinal distance from the Sun's central meridian | |
| Pos. angle | - Position angle | |
| r | - Distance from the centre of Sun's disc in terms of Sun's radius | |
| MU | - Mean magnetic field within the umbra contour averaged the pixel values with sign. | |
| MP | - Mean magnetic field within the penumbra contour averaged the pixel values with sign. | |