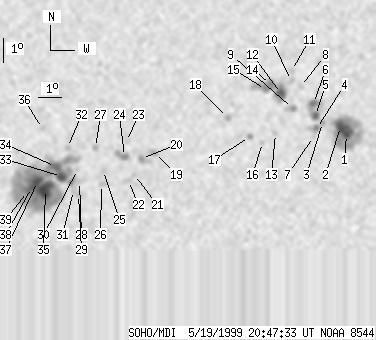
SOHO MDI 1999-05-19 20:47:33 UT
| group | Proj. U | Proj. WS | Corr. U | Corr. WS | B | L | LCM | Pos. angle | r | MU | MP |
| 94 | 755 | 51 | 397 | -20.33 | 119.08 | 4.57 | 193.41 | 0.3340 | 228.3 | 106.5 | |
|
previous
or next observation for the same group /
back to the solar disc SOHO MDI 1999-05-19 20:47:33 UT |
| spot | Proj. U | Proj. WS | Corr. U | Corr. WS | B | L | LCM | Pos. angle | r | MU | MP |
| 3 | 127 | 2 | 68 | -19.46 | 127.05 | 12.54 | 214.53 | 0.3628 | -1571.8 | -675.8 | |
| 10 | -1 | 6 | -1 | -19.13 | 126.77 | 12.26 | 214.49 | 0.3559 | -1837.8 | 999999 | |
| 0 | 6 | 0 | 3 | -18.97 | 126.00 | 11.49 | 213.06 | 0.3467 | -983.0 | -735.7 | |
| 3 | 11 | 2 | 6 | -19.22 | 125.76 | 11.25 | 212.11 | 0.3480 | -1312.4 | -972.0 | |
| 5 | 40 | 3 | 21 | -18.69 | 125.68 | 11.17 | 212.82 | 0.3401 | -1316.1 | -982.5 | |
| 5 | -5 | 2 | -5 | -18.20 | 125.56 | 11.05 | 213.39 | 0.3324 | -1536.0 | 999999 | |
| 0 | 3 | 0 | 2 | -19.55 | 125.65 | 11.14 | 211.35 | 0.3516 | -895.0 | -660.3 | |
| 0 | 6 | 0 | 3 | -17.51 | 124.97 | 10.46 | 213.20 | 0.3177 | -863.0 | -644.0 | |
| 0 | 10 | 0 | 5 | -18.41 | 124.69 | 10.18 | 210.95 | 0.3276 | -1035.0 | -656.1 | |
| 0 | 4 | 0 | 2 | -17.27 | 124.58 | 10.07 | 212.67 | 0.3108 | -994.0 | -861.1 | |
| 0 | 5 | 0 | 2 | -16.86 | 124.56 | 10.05 | 213.36 | 0.3051 | -896.0 | -648.2 | |
| 6 | 62 | 3 | 33 | -17.80 | 124.20 | 9.68 | 210.73 | 0.3148 | -1488.9 | -1101.4 | |
| 0 | 4 | 0 | 2 | -19.44 | 124.04 | 9.53 | 207.73 | 0.3369 | 715.0 | 525.4 | |
| 2 | -12 | 1 | -12 | -17.44 | 123.72 | 9.20 | 210.10 | 0.3056 | -1674.4 | 999999 | |
| 2 | -12 | 1 | -12 | -17.64 | 123.52 | 9.01 | 209.22 | 0.3069 | -1221.7 | 999999 | |
| 0 | 3 | 0 | 2 | -19.81 | 123.51 | 9.00 | 205.90 | 0.3384 | 720.0 | 607.2 | |
| 0 | 4 | 0 | 2 | -19.57 | 122.95 | 8.44 | 204.81 | 0.3308 | 845.0 | 738.4 | |
| 0 | 5 | 0 | 3 | -18.79 | 121.98 | 7.47 | 203.30 | 0.3127 | -808.0 | -277.0 | |
| 0 | 8 | 0 | 4 | -20.29 | 118.98 | 4.47 | 193.24 | 0.3205 | -1021.0 | -916.1 | |
| 0 | 12 | 0 | 6 | -20.50 | 118.44 | 3.93 | 191.54 | 0.3219 | -1151.0 | -796.5 | |
| 0 | 3 | 0 | 1 | -21.16 | 118.16 | 3.65 | 190.35 | 0.3318 | 557.0 | 474.5 | |
| 0 | 7 | 0 | 4 | -21.41 | 117.91 | 3.40 | 189.52 | 0.3352 | 687.0 | 551.1 | |
| 0 | 4 | 0 | 2 | -19.80 | 117.79 | 3.28 | 190.10 | 0.3085 | 665.0 | 485.1 | |
| 3 | 14 | 2 | 7 | -20.42 | 117.72 | 3.21 | 189.53 | 0.3184 | -1054.5 | -815.3 | |
| 0 | 5 | 0 | 3 | -21.00 | 116.85 | 2.34 | 186.74 | 0.3259 | 761.0 | 578.5 | |
| 0 | 6 | 0 | 3 | -21.58 | 116.77 | 2.26 | 186.31 | 0.3354 | 761.0 | 807.8 | |
| 0 | 4 | 0 | 2 | -20.05 | 116.50 | 1.99 | 186.07 | 0.3096 | -961.0 | -829.9 | |
| 0 | 7 | 0 | 4 | -21.46 | 115.84 | 1.33 | 183.75 | 0.3320 | 784.0 | 726.2 | |
| 0 | 5 | 0 | 2 | -22.00 | 115.80 | 1.29 | 183.53 | 0.3409 | 835.0 | 679.7 | |
| 0 | 3 | 0 | 2 | -20.96 | 115.75 | 1.24 | 183.60 | 0.3236 | 831.0 | 698.8 | |
| 0 | 4 | 0 | 2 | -21.83 | 115.59 | 1.08 | 182.98 | 0.3379 | 724.0 | 648.5 | |
| 0 | 5 | 0 | 3 | -20.05 | 115.33 | 0.82 | 182.50 | 0.3081 | 1106.0 | 883.5 | |
| 9 | 374 | 5 | 196 | -21.25 | 115.08 | 0.57 | 181.63 | 0.3279 | 1560.5 | 795.8 | |
| 8 | -33 | 4 | -33 | -20.83 | 114.83 | 0.32 | 180.92 | 0.3210 | 1843.0 | 999999 | |
| 23 | -33 | 12 | -33 | -21.79 | 114.41 | -0.11 | 179.71 | 0.3368 | 1721.9 | 999999 | |
| 0 | 4 | 0 | 2 | -19.26 | 114.28 | -0.23 | 179.26 | 0.2948 | 865.0 | 720.2 | |
| 8 | -33 | 4 | -33 | -21.46 | 114.07 | -0.44 | 178.75 | 0.3313 | 1981.9 | 999999 | |
| 3 | -33 | 2 | -33 | -21.71 | 113.81 | -0.70 | 178.06 | 0.3356 | 1437.2 | 999999 | |
| 4 | -33 | 2 | -33 | -21.87 | 113.64 | -0.87 | 177.61 | 0.3384 | 1261.9 | 999999 | |
| Proj. U | - Projected umbra area in millionths of solar disc, negative values indicate | |
|
that the umbra consists of fragmented regions which cannot be separated without losing umbral area. In this way several spots (intensity minima in the umbra) have a common umbra, e.g. -2 means that the given spot shares an umbra with spot No.2, and the common U value is indicated at spot No.2. |
||
| Proj. WS | - Projected whole spot area in millionths of solar disc, negative values indicate | |
|
that several umbras have a common penumbra, e.g. -7 means that the given umbra shares a penumbra with umbra No.7, and the WS value is indicated at No.7. |
||
| Corr. U | - Corrected umbra area in millionths of solar hemisphere, for negative values see above | |
| Corr. WS | - Corrected whole spot area in millionths of solar hemisphere, for negative values see above | |
| B | - Heliographic latitude B; positive: North, negative: South | |
| L | - Heliographic longitude L | |
| LCM | - Longitudinal distance from the Sun's central meridian | |
| Pos. angle | - Position angle | |
| r | - Distance from the centre of Sun's disc in terms of Sun's radius | |
| MU | - Mean magnetic field within the umbra contour averaged the pixel values with sign. | |
| MP | - Mean magnetic field within the penumbra contour averaged the pixel values with sign. | |