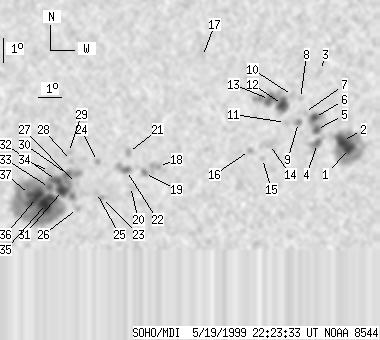
SOHO MDI 1999-05-19 22:23:33 UT
| group | Proj. U | Proj. WS | Corr. U | Corr. WS | B | L | LCM | Pos. angle | r | MU | MP |
| 125 | 785 | 66 | 410 | -20.24 | 119.20 | 5.57 | 196.07 | 0.3368 | 109.2 | 130.2 | |
|
previous
or next observation for the same group /
back to the solar disc SOHO MDI 1999-05-19 22:23:33 UT |
| spot | Proj. U | Proj. WS | Corr. U | Corr. WS | B | L | LCM | Pos. angle | r | MU | MP |
| 9 | 125 | 5 | 67 | -19.48 | 127.16 | 13.53 | 216.49 | 0.3726 | -1503.6 | -574.5 | |
| 15 | -1 | 8 | -1 | -19.16 | 126.84 | 13.21 | 216.40 | 0.3653 | -1805.0 | 999999 | |
| 0 | 7 | 0 | 3 | -16.31 | 125.70 | 12.07 | 219.36 | 0.3179 | -793.0 | -650.0 | |
| 5 | 22 | 2 | 11 | -19.29 | 125.78 | 12.15 | 213.97 | 0.3570 | -1092.4 | -828.9 | |
| 4 | 37 | 2 | 19 | -18.71 | 125.69 | 12.06 | 214.77 | 0.3487 | -1449.0 | -1018.2 | |
| 6 | -5 | 3 | -5 | -18.22 | 125.57 | 11.94 | 215.37 | 0.3411 | -1475.3 | 999999 | |
| 0 | 3 | 0 | 1 | -18.02 | 125.14 | 11.51 | 214.75 | 0.3343 | -1043.0 | -924.5 | |
| 0 | 5 | 0 | 2 | -17.45 | 124.93 | 11.30 | 215.32 | 0.3248 | -821.0 | -775.1 | |
| 0 | 6 | 0 | 3 | -18.43 | 124.91 | 11.28 | 213.50 | 0.3377 | -1233.0 | -926.0 | |
| 0 | 7 | 0 | 4 | -17.33 | 124.59 | 10.96 | 214.73 | 0.3200 | -802.0 | -659.0 | |
| 0 | 5 | 0 | 2 | -18.44 | 124.36 | 10.73 | 212.22 | 0.3329 | -82.0 | -282.9 | |
| 12 | 68 | 6 | 35 | -17.70 | 124.19 | 10.56 | 213.09 | 0.3213 | -1382.5 | -1042.5 | |
| 7 | -12 | 4 | -12 | -17.50 | 123.64 | 10.01 | 212.06 | 0.3136 | -1609.1 | 999999 | |
| 0 | 24 | 0 | 13 | -19.34 | 123.75 | 10.12 | 209.29 | 0.3402 | 108.0 | 165.0 | |
| 0 | 3 | 0 | 2 | -19.92 | 123.48 | 9.85 | 207.81 | 0.3464 | 660.0 | 574.5 | |
| 0 | 4 | 0 | 2 | -19.60 | 122.91 | 9.28 | 206.90 | 0.3374 | 674.0 | 623.0 | |
| 0 | 1 | 0 | 1 | -15.77 | 120.78 | 7.15 | 206.99 | 0.2650 | -757.0 | -735.3 | |
| 0 | 9 | 0 | 5 | -20.27 | 119.11 | 5.48 | 196.09 | 0.3246 | -1192.0 | -893.8 | |
| 0 | 7 | 0 | 4 | -20.57 | 118.53 | 4.90 | 194.23 | 0.3268 | -1075.0 | -898.0 | |
| 0 | 6 | 0 | 3 | -21.11 | 117.96 | 4.33 | 192.24 | 0.3333 | 512.0 | 325.2 | |
| 0 | 6 | 0 | 3 | -19.70 | 117.83 | 4.20 | 192.91 | 0.3101 | 1088.0 | 727.6 | |
| 3 | 16 | 2 | 8 | -20.44 | 117.77 | 4.14 | 192.18 | 0.3219 | -998.9 | -791.5 | |
| 0 | 5 | 0 | 2 | -21.57 | 116.74 | 3.11 | 188.65 | 0.3371 | 1008.0 | 802.3 | |
| 0 | 7 | 0 | 4 | -20.07 | 116.54 | 2.91 | 188.83 | 0.3122 | -890.0 | -556.2 | |
| 0 | 5 | 0 | 3 | -21.36 | 116.53 | 2.90 | 188.15 | 0.3332 | 660.0 | 645.6 | |
| 0 | 4 | 0 | 2 | -22.03 | 115.73 | 2.10 | 185.72 | 0.3426 | 956.0 | 749.6 | |
| 0 | 3 | 0 | 1 | -20.99 | 115.68 | 2.05 | 185.90 | 0.3254 | 660.0 | 676.2 | |
| 0 | 3 | 0 | 2 | -20.03 | 115.45 | 1.82 | 185.57 | 0.3092 | 902.0 | 791.6 | |
| 0 | 8 | 0 | 4 | -19.70 | 115.32 | 1.69 | 185.28 | 0.3036 | 916.0 | 804.7 | |
| 3 | 378 | 2 | 198 | -20.61 | 115.29 | 1.66 | 184.91 | 0.3186 | 1377.4 | 773.1 | |
| 8 | -30 | 4 | -30 | -21.28 | 115.09 | 1.46 | 184.15 | 0.3293 | 1628.9 | 999999 | |
| 6 | -30 | 3 | -30 | -20.86 | 114.83 | 1.20 | 183.50 | 0.3222 | 1903.7 | 999999 | |
| 3 | -30 | 2 | -30 | -21.15 | 114.54 | 0.91 | 182.61 | 0.3267 | 1832.0 | 999999 | |
| 0 | 11 | 0 | 6 | -20.49 | 114.54 | 0.91 | 182.70 | 0.3157 | 897.0 | 854.3 | |
| 27 | -30 | 14 | -30 | -21.82 | 114.42 | 0.79 | 182.17 | 0.3376 | 1642.4 | 999999 | |
| 13 | -30 | 7 | -30 | -21.57 | 113.99 | 0.36 | 181.02 | 0.3333 | 1845.0 | 999999 | |
| 4 | -30 | 2 | -30 | -21.45 | 113.70 | 0.07 | 180.19 | 0.3312 | 1448.1 | 999999 | |
| Proj. U | - Projected umbra area in millionths of solar disc, negative values indicate | |
|
that the umbra consists of fragmented regions which cannot be separated without losing umbral area. In this way several spots (intensity minima in the umbra) have a common umbra, e.g. -2 means that the given spot shares an umbra with spot No.2, and the common U value is indicated at spot No.2. |
||
| Proj. WS | - Projected whole spot area in millionths of solar disc, negative values indicate | |
|
that several umbras have a common penumbra, e.g. -7 means that the given umbra shares a penumbra with umbra No.7, and the WS value is indicated at No.7. |
||
| Corr. U | - Corrected umbra area in millionths of solar hemisphere, for negative values see above | |
| Corr. WS | - Corrected whole spot area in millionths of solar hemisphere, for negative values see above | |
| B | - Heliographic latitude B; positive: North, negative: South | |
| L | - Heliographic longitude L | |
| LCM | - Longitudinal distance from the Sun's central meridian | |
| Pos. angle | - Position angle | |
| r | - Distance from the centre of Sun's disc in terms of Sun's radius | |
| MU | - Mean magnetic field within the umbra contour averaged the pixel values with sign. | |
| MP | - Mean magnetic field within the penumbra contour averaged the pixel values with sign. | |