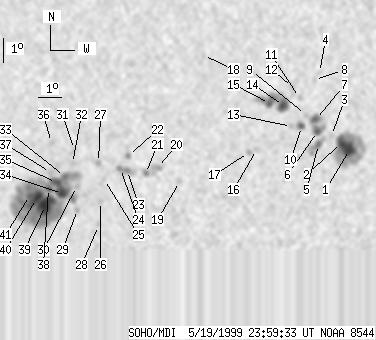
SOHO MDI 1999-05-19 23:59:33 UT
| group | Proj. U | Proj. WS | Corr. U | Corr. WS | B | L | LCM | Pos. angle | r | MU | MP |
| 119 | 805 | 64 | 424 | -20.27 | 119.09 | 6.34 | 197.99 | 0.3412 | 78.2 | 116.9 | |
|
previous
or next observation for the same group /
back to the solar disc SOHO MDI 1999-05-19 23:59:33 UT |
| spot | Proj. U | Proj. WS | Corr. U | Corr. WS | B | L | LCM | Pos. angle | r | MU | MP |
| 14 | 129 | 7 | 69 | -19.47 | 127.18 | 14.43 | 218.24 | 0.3813 | -1553.4 | -527.6 | |
| 11 | -1 | 6 | -1 | -19.18 | 126.81 | 14.06 | 218.03 | 0.3741 | -1768.7 | 999999 | |
| 0 | 4 | 0 | 2 | -18.90 | 126.36 | 13.61 | 217.64 | 0.3661 | -908.0 | -814.9 | |
| 0 | 4 | 0 | 2 | -16.33 | 125.66 | 12.91 | 221.14 | 0.3273 | -854.0 | -636.6 | |
| 3 | 21 | 2 | 11 | -19.27 | 125.83 | 13.09 | 215.94 | 0.3657 | -1166.2 | -856.6 | |
| 5 | 39 | 3 | 21 | -18.74 | 125.75 | 13.00 | 216.69 | 0.3581 | -1433.8 | -1086.3 | |
| 6 | -6 | 3 | -6 | -18.25 | 125.63 | 12.88 | 217.32 | 0.3506 | -1501.0 | 999999 | |
| 0 | 3 | 0 | 2 | -16.62 | 125.47 | 12.72 | 220.14 | 0.3287 | -835.0 | -650.0 | |
| 0 | 5 | 0 | 3 | -18.05 | 125.19 | 12.44 | 216.75 | 0.3437 | -988.0 | -844.3 | |
| 4 | 10 | 2 | 5 | -18.54 | 125.05 | 12.30 | 215.58 | 0.3488 | -1047.8 | -694.1 | |
| 0 | 4 | 0 | 2 | -17.36 | 124.88 | 12.14 | 217.39 | 0.3319 | -761.0 | -701.9 | |
| 0 | 10 | 0 | 5 | -16.95 | 124.56 | 11.82 | 217.45 | 0.3235 | -775.0 | -570.3 | |
| 0 | 5 | 0 | 3 | -18.54 | 124.63 | 11.88 | 214.65 | 0.3448 | -927.0 | -748.4 | |
| 11 | 60 | 6 | 32 | -17.69 | 124.23 | 11.48 | 215.29 | 0.3298 | -1384.1 | -1134.4 | |
| 4 | -14 | 2 | -14 | -17.61 | 123.64 | 10.89 | 214.03 | 0.3232 | -1287.9 | 999999 | |
| 0 | 5 | 0 | 2 | -19.50 | 123.21 | 10.46 | 209.86 | 0.3454 | 873.0 | 653.7 | |
| 0 | 5 | 0 | 3 | -19.62 | 122.88 | 10.13 | 208.89 | 0.3445 | 808.0 | 608.0 | |
| 0 | 3 | 0 | 2 | -15.68 | 120.80 | 8.05 | 209.98 | 0.2710 | -678.0 | -623.1 | |
| 0 | 6 | 0 | 3 | -20.84 | 120.02 | 7.28 | 200.29 | 0.3428 | -895.0 | -660.2 | |
| 0 | 13 | 0 | 7 | -20.26 | 119.07 | 6.32 | 198.39 | 0.3287 | -1025.0 | -702.5 | |
| 0 | 6 | 0 | 3 | -20.51 | 118.57 | 5.82 | 196.80 | 0.3302 | -1053.0 | -932.8 | |
| 0 | 4 | 0 | 2 | -19.77 | 117.83 | 5.08 | 195.42 | 0.3150 | 1036.0 | 848.4 | |
| 1 | 19 | 1 | 10 | -20.39 | 117.81 | 5.06 | 194.81 | 0.3248 | -734.5 | -678.0 | |
| 1 | -23 | 0 | -23 | -20.31 | 117.51 | 4.76 | 194.05 | 0.3222 | -1159.7 | 999999 | |
| 0 | 3 | 0 | 1 | -20.77 | 116.85 | 4.10 | 191.85 | 0.3272 | 622.0 | 473.1 | |
| 0 | 5 | 0 | 2 | -21.68 | 116.71 | 3.96 | 190.88 | 0.3415 | 886.0 | 680.9 | |
| 0 | 4 | 0 | 2 | -20.07 | 116.58 | 3.83 | 191.55 | 0.3149 | -1035.0 | -694.7 | |
| 0 | 2 | 0 | 1 | -22.69 | 116.65 | 3.90 | 190.16 | 0.3575 | 297.0 | 226.8 | |
| 0 | 5 | 0 | 2 | -22.02 | 115.74 | 2.99 | 188.11 | 0.3443 | 1020.0 | 752.7 | |
| 0 | 3 | 0 | 2 | -21.06 | 115.68 | 2.93 | 188.38 | 0.3285 | 933.0 | 742.1 | |
| 0 | 6 | 0 | 3 | -19.53 | 115.57 | 2.82 | 188.83 | 0.3031 | 837.0 | 749.5 | |
| 0 | 4 | 0 | 2 | -20.11 | 115.49 | 2.74 | 188.31 | 0.3124 | 753.0 | 528.6 | |
| 1 | 399 | 1 | 210 | -20.65 | 115.17 | 2.42 | 187.10 | 0.3206 | 1640.0 | 750.8 | |
| 8 | -33 | 4 | -33 | -21.35 | 115.09 | 2.34 | 186.62 | 0.3320 | 1568.2 | 999999 | |
| 7 | -33 | 4 | -33 | -20.90 | 114.83 | 2.08 | 186.04 | 0.3241 | 1894.1 | 999999 | |
| 0 | 4 | 0 | 2 | -19.24 | 114.60 | 1.85 | 185.94 | 0.2963 | 544.0 | 766.4 | |
| 0 | 15 | 0 | 8 | -20.48 | 114.58 | 1.83 | 185.43 | 0.3168 | 924.0 | 845.1 | |
| 3 | -33 | 2 | -33 | -21.15 | 114.50 | 1.75 | 185.01 | 0.3276 | 1870.4 | 999999 | |
| 23 | -33 | 12 | -33 | -21.85 | 114.38 | 1.63 | 184.49 | 0.3391 | 1696.0 | 999999 | |
| 14 | -33 | 7 | -33 | -21.56 | 114.00 | 1.25 | 183.49 | 0.3339 | 1852.6 | 999999 | |
| 3 | -33 | 2 | -33 | -21.44 | 113.70 | 0.95 | 182.68 | 0.3316 | 1553.3 | 999999 | |
| Proj. U | - Projected umbra area in millionths of solar disc, negative values indicate | |
|
that the umbra consists of fragmented regions which cannot be separated without losing umbral area. In this way several spots (intensity minima in the umbra) have a common umbra, e.g. -2 means that the given spot shares an umbra with spot No.2, and the common U value is indicated at spot No.2. |
||
| Proj. WS | - Projected whole spot area in millionths of solar disc, negative values indicate | |
|
that several umbras have a common penumbra, e.g. -7 means that the given umbra shares a penumbra with umbra No.7, and the WS value is indicated at No.7. |
||
| Corr. U | - Corrected umbra area in millionths of solar hemisphere, for negative values see above | |
| Corr. WS | - Corrected whole spot area in millionths of solar hemisphere, for negative values see above | |
| B | - Heliographic latitude B; positive: North, negative: South | |
| L | - Heliographic longitude L | |
| LCM | - Longitudinal distance from the Sun's central meridian | |
| Pos. angle | - Position angle | |
| r | - Distance from the centre of Sun's disc in terms of Sun's radius | |
| MU | - Mean magnetic field within the umbra contour averaged the pixel values with sign. | |
| MP | - Mean magnetic field within the penumbra contour averaged the pixel values with sign. | |