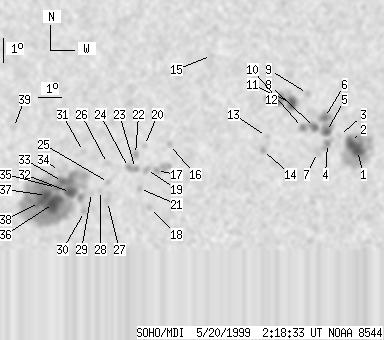
SOHO MDI 1999-05-20 02:18:33 UT
| group | Proj. U | Proj. WS | Corr. U | Corr. WS | B | L | LCM | Pos. angle | r | MU | MP |
| 122 | 813 | 67 | 430 | -20.50 | 118.72 | 7.25 | 199.93 | 0.3490 | 81.8 | 172.0 | |
|
previous
or next observation for the same group /
back to the solar disc SOHO MDI 1999-05-20 02:18:33 UT |
| spot | Proj. U | Proj. WS | Corr. U | Corr. WS | B | L | LCM | Pos. angle | r | MU | MP |
| 13 | 124 | 7 | 67 | -19.57 | 127.21 | 15.74 | 220.39 | 0.3960 | -1617.1 | -576.8 | |
| 10 | -1 | 5 | -1 | -19.24 | 126.87 | 15.40 | 220.38 | 0.3887 | -1739.6 | 999999 | |
| 0 | 4 | 0 | 2 | -18.96 | 126.37 | 14.90 | 219.98 | 0.3801 | -847.0 | -674.0 | |
| 3 | 12 | 2 | 6 | -19.29 | 125.89 | 14.41 | 218.48 | 0.3792 | -1046.4 | -814.4 | |
| 7 | 39 | 4 | 21 | -18.80 | 125.80 | 14.33 | 219.19 | 0.3723 | -1385.5 | -999.4 | |
| 5 | -5 | 3 | -5 | -18.23 | 125.66 | 14.19 | 219.98 | 0.3640 | -1472.3 | 999999 | |
| 0 | 7 | 0 | 4 | -19.67 | 125.49 | 14.02 | 217.09 | 0.3798 | -996.0 | -659.6 | |
| 6 | 16 | 3 | 8 | -18.64 | 125.27 | 13.80 | 218.46 | 0.3650 | -1224.5 | -911.6 | |
| 0 | 4 | 0 | 2 | -17.26 | 124.87 | 13.39 | 220.26 | 0.3438 | -751.0 | -861.9 | |
| 3 | 7 | 2 | 4 | -18.65 | 124.76 | 13.29 | 217.43 | 0.3599 | -1157.0 | -911.9 | |
| 9 | 56 | 5 | 29 | -17.67 | 124.22 | 12.75 | 218.10 | 0.3422 | -1496.5 | -1153.2 | |
| 3 | -11 | 2 | -11 | -17.63 | 123.67 | 12.19 | 216.98 | 0.3362 | -1233.8 | 999999 | |
| 0 | 3 | 0 | 2 | -19.03 | 123.26 | 11.78 | 213.59 | 0.3505 | 549.0 | 458.7 | |
| 0 | 6 | 0 | 3 | -19.61 | 123.13 | 11.66 | 212.37 | 0.3571 | 1156.0 | 947.1 | |
| 0 | 1 | 0 | 0 | -15.74 | 120.76 | 9.29 | 213.45 | 0.2831 | -766.0 | -727.3 | |
| 0 | 4 | 0 | 2 | -19.38 | 119.18 | 7.71 | 203.13 | 0.3235 | -705.0 | -556.0 | |
| 0 | 21 | 0 | 11 | -20.46 | 118.68 | 7.21 | 200.53 | 0.3368 | -1191.0 | -810.5 | |
| 0 | 3 | 0 | 2 | -22.00 | 118.46 | 6.99 | 198.39 | 0.3592 | -782.0 | -556.9 | |
| 0 | 6 | 0 | 3 | -20.42 | 118.26 | 6.79 | 199.47 | 0.3338 | -1168.0 | -829.4 | |
| 0 | 3 | 0 | 2 | -19.43 | 118.13 | 6.66 | 200.23 | 0.3178 | 498.0 | 461.9 | |
| 0 | 3 | 0 | 2 | -21.21 | 118.00 | 6.53 | 197.99 | 0.3447 | 757.0 | 653.3 | |
| 0 | 5 | 0 | 3 | -19.80 | 117.77 | 6.30 | 198.81 | 0.3216 | 1036.0 | 845.3 | |
| 2 | 12 | 1 | 6 | -20.38 | 117.79 | 6.32 | 198.27 | 0.3307 | -805.4 | -687.9 | |
| 3 | -23 | 1 | -23 | -20.34 | 117.50 | 6.02 | 197.51 | 0.3286 | -876.5 | 999999 | |
| 0 | 4 | 0 | 2 | -20.96 | 116.68 | 5.20 | 194.72 | 0.3347 | 924.0 | 789.4 | |
| 0 | 5 | 0 | 3 | -20.18 | 116.61 | 5.13 | 195.20 | 0.3218 | -1048.0 | -674.5 | |
| 0 | 7 | 0 | 4 | -21.76 | 116.66 | 5.19 | 194.06 | 0.3472 | 734.0 | 746.2 | |
| 0 | 4 | 0 | 2 | -21.30 | 116.35 | 4.88 | 193.58 | 0.3387 | 456.0 | 616.8 | |
| 0 | 3 | 0 | 2 | -21.38 | 115.97 | 4.50 | 192.51 | 0.3386 | 701.0 | 775.4 | |
| 0 | 5 | 0 | 3 | -22.18 | 115.70 | 4.23 | 191.28 | 0.3504 | 988.0 | 769.5 | |
| 0 | 4 | 0 | 2 | -19.68 | 115.59 | 4.11 | 192.65 | 0.3098 | 786.0 | 720.6 | |
| 11 | 430 | 6 | 226 | -21.38 | 115.08 | 3.61 | 190.10 | 0.3358 | 1497.9 | 742.7 | |
| 5 | -32 | 3 | -32 | -20.93 | 114.73 | 3.26 | 189.38 | 0.3274 | 1840.1 | 999999 | |
| 0 | 10 | 0 | 5 | -20.51 | 114.60 | 3.13 | 189.22 | 0.3202 | 1110.0 | 874.3 | |
| 3 | -32 | 2 | -32 | -21.18 | 114.49 | 3.01 | 188.56 | 0.3308 | 1919.2 | 999999 | |
| 24 | -32 | 13 | -32 | -21.84 | 114.37 | 2.90 | 187.94 | 0.3414 | 1693.8 | 999999 | |
| 8 | -32 | 4 | -32 | -21.51 | 114.07 | 2.60 | 187.25 | 0.3353 | 2120.5 | 999999 | |
| 7 | -32 | 4 | -32 | -21.80 | 113.78 | 2.31 | 186.34 | 0.3395 | 1457.2 | 999999 | |
| 0 | 5 | 0 | 2 | -18.70 | 112.65 | 1.18 | 183.92 | 0.2865 | 856.0 | 713.4 | |
| Proj. U | - Projected umbra area in millionths of solar disc, negative values indicate | |
|
that the umbra consists of fragmented regions which cannot be separated without losing umbral area. In this way several spots (intensity minima in the umbra) have a common umbra, e.g. -2 means that the given spot shares an umbra with spot No.2, and the common U value is indicated at spot No.2. |
||
| Proj. WS | - Projected whole spot area in millionths of solar disc, negative values indicate | |
|
that several umbras have a common penumbra, e.g. -7 means that the given umbra shares a penumbra with umbra No.7, and the WS value is indicated at No.7. |
||
| Corr. U | - Corrected umbra area in millionths of solar hemisphere, for negative values see above | |
| Corr. WS | - Corrected whole spot area in millionths of solar hemisphere, for negative values see above | |
| B | - Heliographic latitude B; positive: North, negative: South | |
| L | - Heliographic longitude L | |
| LCM | - Longitudinal distance from the Sun's central meridian | |
| Pos. angle | - Position angle | |
| r | - Distance from the centre of Sun's disc in terms of Sun's radius | |
| MU | - Mean magnetic field within the umbra contour averaged the pixel values with sign. | |
| MP | - Mean magnetic field within the penumbra contour averaged the pixel values with sign. | |