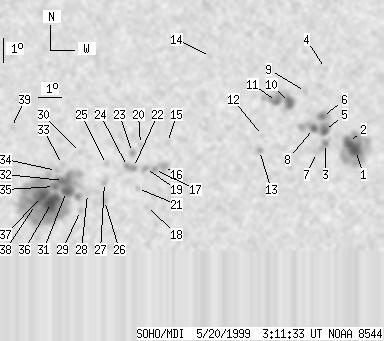
SOHO MDI 1999-05-20 03:11:33 UT
| group | Proj. U | Proj. WS | Corr. U | Corr. WS | B | L | LCM | Pos. angle | r | MU | MP |
| 110 | 770 | 58 | 409 | -20.37 | 119.10 | 8.12 | 202.18 | 0.3524 | 190.3 | 122.5 | |
|
previous
or next observation for the same group /
back to the solar disc SOHO MDI 1999-05-20 03:11:33 UT |
| spot | Proj. U | Proj. WS | Corr. U | Corr. WS | B | L | LCM | Pos. angle | r | MU | MP |
| 12 | 123 | 7 | 66 | -19.60 | 127.25 | 16.26 | 221.23 | 0.4020 | -1517.8 | -587.3 | |
| 8 | -1 | 4 | -1 | -19.28 | 126.91 | 15.92 | 221.23 | 0.3947 | -1752.9 | 999999 | |
| 3 | 8 | 2 | 5 | -19.33 | 125.92 | 14.94 | 219.38 | 0.3849 | -995.6 | -785.8 | |
| 0 | 3 | 0 | 2 | -16.27 | 125.66 | 14.67 | 224.81 | 0.3466 | -821.0 | -558.8 | |
| 6 | 66 | 3 | 35 | -18.80 | 125.83 | 14.84 | 220.17 | 0.3776 | -1400.9 | -966.7 | |
| 5 | -5 | 2 | -5 | -18.22 | 125.69 | 14.71 | 220.97 | 0.3694 | -1453.4 | 999999 | |
| 0 | 9 | 0 | 5 | -19.70 | 125.57 | 14.58 | 218.09 | 0.3859 | -463.0 | -626.8 | |
| 5 | -5 | 2 | -5 | -18.72 | 125.35 | 14.36 | 219.41 | 0.3717 | -1170.1 | 999999 | |
| 0 | 4 | 0 | 2 | -17.21 | 124.89 | 13.90 | 221.37 | 0.3487 | -937.0 | -809.5 | |
| 9 | 63 | 5 | 33 | -17.66 | 124.24 | 13.26 | 219.18 | 0.3474 | -1510.1 | -1049.6 | |
| 3 | -10 | 2 | -10 | -17.63 | 123.69 | 12.70 | 218.09 | 0.3412 | -1361.7 | 999999 | |
| 0 | 4 | 0 | 2 | -19.02 | 123.20 | 12.21 | 214.52 | 0.3544 | 404.0 | 318.1 | |
| 0 | 8 | 0 | 4 | -19.64 | 123.12 | 12.13 | 213.32 | 0.3618 | 1151.0 | 851.6 | |
| 0 | 2 | 0 | 1 | -15.82 | 120.82 | 9.83 | 214.78 | 0.2893 | -646.0 | -608.5 | |
| 0 | 3 | 0 | 2 | -19.34 | 119.20 | 8.21 | 204.52 | 0.3263 | -538.0 | -512.1 | |
| 0 | 11 | 0 | 6 | -20.33 | 119.08 | 8.10 | 202.94 | 0.3403 | -1164.0 | -898.5 | |
| 0 | 7 | 0 | 4 | -20.45 | 118.71 | 7.72 | 201.84 | 0.3398 | -1039.0 | -854.1 | |
| 0 | 3 | 0 | 2 | -21.99 | 118.45 | 7.46 | 199.53 | 0.3617 | -769.0 | -591.8 | |
| 0 | 8 | 0 | 4 | -20.41 | 118.32 | 7.34 | 200.91 | 0.3369 | -1285.0 | -840.2 | |
| 0 | 4 | 0 | 2 | -19.42 | 118.07 | 7.08 | 201.39 | 0.3203 | 465.0 | 419.5 | |
| 0 | 4 | 0 | 2 | -21.25 | 118.03 | 7.04 | 199.25 | 0.3480 | 998.0 | 674.9 | |
| 2 | 16 | 1 | 8 | -20.37 | 117.82 | 6.83 | 199.62 | 0.3334 | -925.2 | -646.3 | |
| 0 | 6 | 0 | 3 | -19.76 | 117.75 | 6.76 | 200.12 | 0.3235 | 911.0 | 825.4 | |
| 1 | -22 | 0 | -22 | -20.33 | 117.56 | 6.57 | 198.99 | 0.3314 | -1107.2 | 999999 | |
| 0 | 4 | 0 | 2 | -20.26 | 116.67 | 5.69 | 196.66 | 0.3257 | -705.0 | -694.1 | |
| 0 | 4 | 0 | 2 | -21.75 | 116.64 | 5.66 | 195.28 | 0.3491 | 905.0 | 737.9 | |
| 0 | 6 | 0 | 3 | -21.00 | 116.62 | 5.63 | 195.83 | 0.3372 | 1133.0 | 768.0 | |
| 0 | 3 | 0 | 2 | -21.46 | 115.91 | 4.93 | 193.59 | 0.3415 | 965.0 | 812.6 | |
| 0 | 4 | 0 | 2 | -22.17 | 115.64 | 4.65 | 192.38 | 0.3519 | 969.0 | 716.6 | |
| 0 | 2 | 0 | 1 | -19.76 | 115.56 | 4.58 | 193.95 | 0.3130 | 804.0 | 733.5 | |
| 6 | 386 | 3 | 203 | -21.38 | 115.02 | 4.03 | 191.26 | 0.3371 | 1586.8 | 795.2 | |
| 10 | -31 | 5 | -31 | -20.92 | 114.88 | 3.90 | 191.16 | 0.3293 | 1840.1 | 999999 | |
| 0 | 3 | 0 | 2 | -20.26 | 114.82 | 3.84 | 191.42 | 0.3183 | 1064.0 | 826.7 | |
| 0 | 3 | 0 | 2 | -20.51 | 114.58 | 3.59 | 190.56 | 0.3216 | 1096.0 | 946.0 | |
| 3 | -31 | 2 | -31 | -21.17 | 114.51 | 3.52 | 189.97 | 0.3322 | 1946.5 | 999999 | |
| 22 | -31 | 12 | -31 | -21.84 | 114.40 | 3.41 | 189.31 | 0.3427 | 1729.6 | 999999 | |
| 13 | -31 | 7 | -31 | -21.59 | 113.97 | 2.98 | 188.27 | 0.3376 | 1965.0 | 999999 | |
| 2 | -31 | 1 | -31 | -21.93 | 113.72 | 2.73 | 187.46 | 0.3425 | 1361.1 | 999999 | |
| 0 | 3 | 0 | 2 | -18.74 | 112.67 | 1.68 | 185.56 | 0.2879 | 768.0 | 632.7 | |
| Proj. U | - Projected umbra area in millionths of solar disc, negative values indicate | |
|
that the umbra consists of fragmented regions which cannot be separated without losing umbral area. In this way several spots (intensity minima in the umbra) have a common umbra, e.g. -2 means that the given spot shares an umbra with spot No.2, and the common U value is indicated at spot No.2. |
||
| Proj. WS | - Projected whole spot area in millionths of solar disc, negative values indicate | |
|
that several umbras have a common penumbra, e.g. -7 means that the given umbra shares a penumbra with umbra No.7, and the WS value is indicated at No.7. |
||
| Corr. U | - Corrected umbra area in millionths of solar hemisphere, for negative values see above | |
| Corr. WS | - Corrected whole spot area in millionths of solar hemisphere, for negative values see above | |
| B | - Heliographic latitude B; positive: North, negative: South | |
| L | - Heliographic longitude L | |
| LCM | - Longitudinal distance from the Sun's central meridian | |
| Pos. angle | - Position angle | |
| r | - Distance from the centre of Sun's disc in terms of Sun's radius | |
| MU | - Mean magnetic field within the umbra contour averaged the pixel values with sign. | |
| MP | - Mean magnetic field within the penumbra contour averaged the pixel values with sign. | |