SOHO MDI 1999-05-20 04:47:33 UT
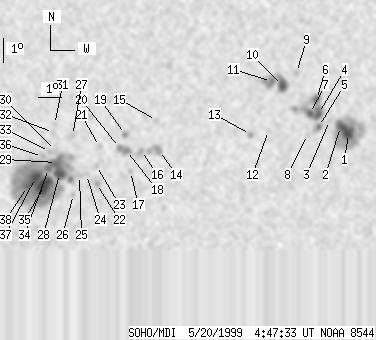
| group | Proj. U | Proj. WS | Corr. U | Corr. WS | B | L | LCM | Pos. angle | r | MU | MP |
| 125 | 758 | 69 | 402 | -20.44 | 119.01 | 8.91 | 203.88 | 0.3583 | 268.1 | 140.3 | |
|
previous
or next observation for the same group /
back to the solar disc SOHO MDI 1999-05-20 04:47:33 UT |
| spot | Proj. U | Proj. WS | Corr. U | Corr. WS | B | L | LCM | Pos. angle | r | MU | MP |
| 12 | 120 | 7 | 65 | -19.63 | 127.29 | 17.18 | 222.68 | 0.4122 | -1493.9 | -586.4 | |
| 9 | -1 | 5 | -1 | -19.34 | 126.91 | 16.80 | 222.57 | 0.4049 | -1711.5 | 999999 | |
| 0 | 2 | 0 | 1 | -19.10 | 126.41 | 16.30 | 222.17 | 0.3968 | -667.0 | -681.0 | |
| 9 | 76 | 5 | 41 | -18.82 | 125.90 | 15.80 | 221.82 | 0.3881 | -1298.5 | -940.3 | |
| 3 | 12 | 2 | 6 | -19.35 | 125.95 | 15.85 | 220.95 | 0.3948 | -1016.7 | -740.9 | |
| 4 | -4 | 2 | -4 | -18.25 | 125.76 | 15.66 | 222.64 | 0.3800 | -1272.2 | 999999 | |
| 4 | -4 | 2 | -4 | -18.82 | 125.51 | 15.41 | 221.13 | 0.3840 | -1274.1 | 999999 | |
| 0 | 3 | 0 | 1 | -19.69 | 125.51 | 15.41 | 219.60 | 0.3941 | -899.0 | -762.8 | |
| 0 | 5 | 0 | 2 | -17.15 | 124.81 | 14.71 | 223.03 | 0.3570 | -910.0 | -809.6 | |
| 9 | 47 | 5 | 25 | -17.69 | 124.26 | 14.15 | 220.92 | 0.3572 | -1479.5 | -1074.2 | |
| 3 | -10 | 2 | -10 | -17.53 | 123.78 | 13.67 | 220.28 | 0.3502 | -1616.9 | 999999 | |
| 0 | 4 | 0 | 2 | -19.54 | 123.82 | 13.71 | 216.70 | 0.3754 | 306.0 | 303.2 | |
| 0 | 4 | 0 | 2 | -19.71 | 123.06 | 12.95 | 214.91 | 0.3703 | 1187.0 | 953.8 | |
| 0 | 18 | 0 | 10 | -20.40 | 119.23 | 9.12 | 205.37 | 0.3483 | -789.0 | -815.4 | |
| 0 | 4 | 0 | 2 | -19.16 | 119.03 | 8.92 | 206.59 | 0.3288 | -539.0 | -500.8 | |
| 0 | 8 | 0 | 4 | -20.40 | 118.46 | 8.36 | 203.50 | 0.3432 | -1248.0 | -847.6 | |
| 0 | 3 | 0 | 2 | -21.27 | 118.04 | 7.94 | 201.44 | 0.3537 | 830.0 | 621.0 | |
| 3 | 16 | 2 | 9 | -20.40 | 117.83 | 7.72 | 201.90 | 0.3392 | -902.5 | -671.5 | |
| 0 | 5 | 0 | 3 | -19.74 | 117.75 | 7.65 | 202.50 | 0.3287 | 1151.0 | 920.1 | |
| 2 | -18 | 1 | -18 | -20.28 | 117.52 | 7.42 | 201.26 | 0.3355 | -1065.0 | 999999 | |
| 0 | 3 | 0 | 2 | -20.24 | 116.68 | 6.57 | 199.08 | 0.3301 | -887.0 | -684.9 | |
| 0 | 10 | 0 | 5 | -21.78 | 116.62 | 6.52 | 197.41 | 0.3537 | 1043.0 | 777.2 | |
| 0 | 3 | 0 | 2 | -21.03 | 116.59 | 6.48 | 198.03 | 0.3419 | 895.0 | 849.4 | |
| 0 | 3 | 0 | 2 | -21.41 | 116.18 | 6.07 | 196.63 | 0.3457 | 839.0 | 806.0 | |
| 0 | 5 | 0 | 2 | -21.45 | 115.88 | 5.78 | 195.83 | 0.3450 | 899.0 | 827.2 | |
| 0 | 4 | 0 | 2 | -22.24 | 115.66 | 5.55 | 194.62 | 0.3566 | 894.0 | 664.5 | |
| 0 | 8 | 0 | 4 | -19.79 | 115.53 | 5.42 | 196.35 | 0.3172 | 965.0 | 730.5 | |
| 10 | 377 | 5 | 198 | -21.37 | 115.03 | 4.93 | 193.66 | 0.3402 | 1603.1 | 770.0 | |
| 11 | -28 | 6 | -28 | -20.91 | 114.89 | 4.79 | 193.62 | 0.3323 | 1720.3 | 999999 | |
| 0 | 2 | 0 | 1 | -20.41 | 114.83 | 4.73 | 193.85 | 0.3241 | 1039.0 | 1001.0 | |
| 0 | 3 | 0 | 2 | -19.34 | 114.76 | 4.65 | 194.52 | 0.3066 | 822.0 | 741.8 | |
| 0 | 5 | 0 | 3 | -19.67 | 114.73 | 4.62 | 194.15 | 0.3118 | 812.0 | 624.0 | |
| 0 | 3 | 0 | 2 | -20.46 | 114.58 | 4.48 | 193.11 | 0.3239 | 840.0 | 877.5 | |
| 4 | -28 | 2 | -28 | -21.16 | 114.56 | 4.45 | 192.54 | 0.3351 | 1890.7 | 999999 | |
| 24 | -28 | 13 | -28 | -21.87 | 114.41 | 4.31 | 191.67 | 0.3460 | 1696.8 | 999999 | |
| 0 | 5 | 0 | 2 | -20.66 | 114.29 | 4.19 | 192.15 | 0.3262 | 1355.0 | 1043.3 | |
| 13 | -28 | 7 | -28 | -21.54 | 114.02 | 3.92 | 190.84 | 0.3394 | 1995.3 | 999999 | |
| 5 | -28 | 3 | -28 | -21.91 | 113.69 | 3.59 | 189.74 | 0.3445 | 1483.1 | 999999 | |
| Proj. U | - Projected umbra area in millionths of solar disc, negative values indicate | |
|
that the umbra consists of fragmented regions which cannot be separated without losing umbral area. In this way several spots (intensity minima in the umbra) have a common umbra, e.g. -2 means that the given spot shares an umbra with spot No.2, and the common U value is indicated at spot No.2. |
||
| Proj. WS | - Projected whole spot area in millionths of solar disc, negative values indicate | |
|
that several umbras have a common penumbra, e.g. -7 means that the given umbra shares a penumbra with umbra No.7, and the WS value is indicated at No.7. |
||
| Corr. U | - Corrected umbra area in millionths of solar hemisphere, for negative values see above | |
| Corr. WS | - Corrected whole spot area in millionths of solar hemisphere, for negative values see above | |
| B | - Heliographic latitude B; positive: North, negative: South | |
| L | - Heliographic longitude L | |
| LCM | - Longitudinal distance from the Sun's central meridian | |
| Pos. angle | - Position angle | |
| r | - Distance from the centre of Sun's disc in terms of Sun's radius | |
| MU | - Mean magnetic field within the umbra contour averaged the pixel values with sign. | |
| MP | - Mean magnetic field within the penumbra contour averaged the pixel values with sign. | |