SOHO MDI 1999-05-20 09:35:33 UT
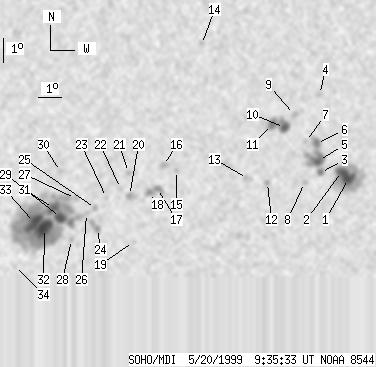
| group | Proj. U | Proj. WS | Corr. U | Corr. WS | B | L | LCM | Pos. angle | r | MU | MP |
| 118 | 740 | 63 | 397 | -20.57 | 118.77 | 11.31 | 209.09 | 0.3772 | 130.4 | 185.8 | |
|
previous
or next observation for the same group /
back to the solar disc SOHO MDI 1999-05-20 09:35:33 UT |
| spot | Proj. U | Proj. WS | Corr. U | Corr. WS | B | L | LCM | Pos. angle | r | MU | MP |
| 12 | 108 | 7 | 59 | -19.74 | 127.39 | 19.92 | 226.49 | 0.4441 | -1446.7 | -576.6 | |
| 11 | -1 | 6 | -1 | -19.45 | 127.04 | 19.58 | 226.51 | 0.4373 | -1691.6 | 999999 | |
| 3 | 68 | 2 | 37 | -19.51 | 126.12 | 18.66 | 225.11 | 0.4274 | -1062.1 | -1002.9 | |
| 0 | 8 | 0 | 4 | -16.32 | 125.73 | 18.27 | 230.63 | 0.3908 | -778.0 | -657.0 | |
| 9 | -3 | 5 | -3 | -19.01 | 125.97 | 18.51 | 225.78 | 0.4206 | -1438.2 | 999999 | |
| 5 | -3 | 2 | -3 | -18.32 | 125.81 | 18.34 | 226.81 | 0.4115 | -1211.7 | 999999 | |
| 0 | 3 | 0 | 2 | -18.24 | 125.32 | 17.86 | 226.22 | 0.4051 | -1074.0 | -845.4 | |
| 0 | 3 | 0 | 2 | -19.93 | 125.46 | 18.00 | 223.40 | 0.4247 | -878.0 | -743.3 | |
| 0 | 5 | 0 | 3 | -17.15 | 124.73 | 17.27 | 227.43 | 0.3868 | -685.0 | -834.9 | |
| 8 | 40 | 5 | 21 | -17.68 | 124.35 | 16.89 | 225.77 | 0.3880 | -1248.7 | -1110.8 | |
| 6 | -10 | 3 | -10 | -17.56 | 123.82 | 16.36 | 225.12 | 0.3806 | -1367.6 | 999999 | |
| 0 | 5 | 0 | 2 | -19.94 | 123.84 | 16.38 | 220.80 | 0.4076 | 959.0 | 755.3 | |
| 0 | 7 | 0 | 4 | -19.79 | 122.96 | 15.50 | 219.55 | 0.3966 | 561.0 | 587.2 | |
| 0 | 5 | 0 | 3 | -14.35 | 120.58 | 13.12 | 225.97 | 0.3071 | -831.0 | -718.6 | |
| 0 | 4 | 0 | 2 | -19.48 | 119.88 | 12.42 | 214.14 | 0.3628 | -876.0 | -628.9 | |
| 0 | 7 | 0 | 4 | -19.28 | 119.31 | 11.85 | 213.25 | 0.3549 | -1154.0 | -766.4 | |
| 1 | 19 | 0 | 10 | -20.23 | 119.12 | 11.66 | 211.35 | 0.3661 | -1313.4 | -903.5 | |
| 1 | -17 | 0 | -17 | -20.40 | 118.79 | 11.33 | 210.39 | 0.3657 | -1308.0 | 999999 | |
| 0 | 2 | 0 | 1 | -22.45 | 118.26 | 10.80 | 206.48 | 0.3901 | -633.0 | -548.5 | |
| 0 | 9 | 0 | 5 | -20.53 | 117.95 | 10.49 | 208.34 | 0.3607 | -1117.0 | -874.7 | |
| 0 | 4 | 0 | 2 | -19.58 | 117.84 | 10.38 | 209.48 | 0.3465 | 1147.0 | 865.1 | |
| 0 | 3 | 0 | 2 | -20.24 | 117.55 | 10.08 | 207.82 | 0.3535 | -658.0 | -536.3 | |
| 0 | 3 | 0 | 2 | -20.62 | 116.97 | 9.51 | 205.98 | 0.3547 | 553.0 | 459.4 | |
| 0 | 13 | 0 | 7 | -21.91 | 116.67 | 9.21 | 203.67 | 0.3715 | 988.0 | 920.6 | |
| 0 | 4 | 0 | 2 | -21.08 | 116.53 | 9.07 | 204.36 | 0.3583 | 692.0 | 557.4 | |
| 0 | 3 | 0 | 2 | -21.29 | 116.16 | 8.70 | 203.23 | 0.3590 | 928.0 | 795.0 | |
| 0 | 5 | 0 | 3 | -20.67 | 115.66 | 8.20 | 202.75 | 0.3465 | 24.0 | -117.2 | |
| 0 | 3 | 0 | 1 | -22.38 | 115.58 | 8.12 | 200.67 | 0.3717 | 802.0 | 629.8 | |
| 10 | 402 | 5 | 213 | -21.46 | 115.06 | 7.60 | 200.39 | 0.3549 | 1504.1 | 791.3 | |
| 0 | 4 | 0 | 2 | -19.55 | 114.97 | 7.51 | 202.34 | 0.3254 | 846.0 | 813.0 | |
| 11 | -29 | 6 | -29 | -21.09 | 114.75 | 7.29 | 200.00 | 0.3474 | 1891.5 | 999999 | |
| 24 | -29 | 13 | -29 | -21.92 | 114.40 | 6.94 | 198.32 | 0.3584 | 1692.5 | 999999 | |
| 17 | -29 | 9 | -29 | -21.67 | 113.97 | 6.51 | 197.47 | 0.3523 | 1911.6 | 999999 | |
| 0 | 3 | 0 | 2 | -23.48 | 113.19 | 5.73 | 194.11 | 0.3771 | -693.0 | -510.4 | |
| Proj. U | - Projected umbra area in millionths of solar disc, negative values indicate | |
|
that the umbra consists of fragmented regions which cannot be separated without losing umbral area. In this way several spots (intensity minima in the umbra) have a common umbra, e.g. -2 means that the given spot shares an umbra with spot No.2, and the common U value is indicated at spot No.2. |
||
| Proj. WS | - Projected whole spot area in millionths of solar disc, negative values indicate | |
|
that several umbras have a common penumbra, e.g. -7 means that the given umbra shares a penumbra with umbra No.7, and the WS value is indicated at No.7. |
||
| Corr. U | - Corrected umbra area in millionths of solar hemisphere, for negative values see above | |
| Corr. WS | - Corrected whole spot area in millionths of solar hemisphere, for negative values see above | |
| B | - Heliographic latitude B; positive: North, negative: South | |
| L | - Heliographic longitude L | |
| LCM | - Longitudinal distance from the Sun's central meridian | |
| Pos. angle | - Position angle | |
| r | - Distance from the centre of Sun's disc in terms of Sun's radius | |
| MU | - Mean magnetic field within the umbra contour averaged the pixel values with sign. | |
| MP | - Mean magnetic field within the penumbra contour averaged the pixel values with sign. | |