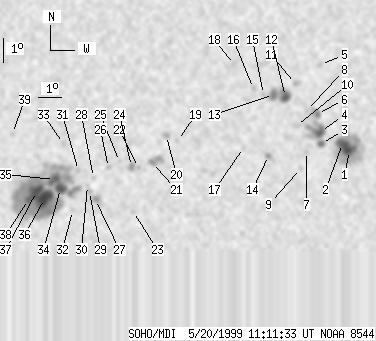
SOHO MDI 1999-05-20 11:11:33 UT
| group | Proj. U | Proj. WS | Corr. U | Corr. WS | B | L | LCM | Pos. angle | r | MU | MP |
| 112 | 734 | 59 | 394 | -20.55 | 119.11 | 12.53 | 211.53 | 0.3873 | 149.2 | 157.5 | |
|
previous
or next observation for the same group /
back to the solar disc SOHO MDI 1999-05-20 11:11:33 UT |
| spot | Proj. U | Proj. WS | Corr. U | Corr. WS | B | L | LCM | Pos. angle | r | MU | MP |
| 11 | 117 | 6 | 65 | -19.80 | 127.45 | 20.87 | 227.62 | 0.4557 | -1426.7 | -550.5 | |
| 11 | -1 | 6 | -1 | -19.52 | 127.10 | 20.52 | 227.66 | 0.4489 | -1710.9 | 999999 | |
| 4 | 54 | 2 | 30 | -19.53 | 126.17 | 19.59 | 226.39 | 0.4383 | -1058.4 | -957.5 | |
| 8 | -3 | 4 | -3 | -19.04 | 126.07 | 19.49 | 227.12 | 0.4321 | -1402.9 | 999999 | |
| 0 | 4 | 0 | 2 | -16.30 | 125.76 | 19.18 | 231.94 | 0.4021 | -783.0 | -776.8 | |
| 3 | 11 | 2 | 6 | -18.30 | 125.85 | 19.27 | 228.16 | 0.4223 | -1215.9 | -987.4 | |
| 0 | 3 | 0 | 2 | -19.87 | 125.55 | 18.97 | 224.92 | 0.4348 | -670.0 | -549.0 | |
| 0 | 2 | 0 | 1 | -18.18 | 125.35 | 18.77 | 227.68 | 0.4152 | -1083.0 | -1025.9 | |
| 0 | 4 | 0 | 2 | -20.57 | 125.37 | 18.79 | 223.47 | 0.4403 | -457.0 | -438.7 | |
| 0 | 6 | 0 | 3 | -18.80 | 124.98 | 18.40 | 225.99 | 0.4173 | -777.0 | -616.5 | |
| 0 | 7 | 0 | 4 | -17.09 | 124.75 | 18.18 | 228.92 | 0.3972 | -926.0 | -751.6 | |
| 8 | 42 | 4 | 23 | -17.62 | 124.38 | 17.80 | 227.30 | 0.3981 | -1290.3 | -1107.4 | |
| 5 | -12 | 3 | -12 | -17.55 | 123.85 | 17.27 | 226.63 | 0.3911 | -1472.8 | 999999 | |
| 0 | 8 | 0 | 5 | -20.05 | 123.90 | 17.32 | 222.12 | 0.4187 | 902.0 | 691.0 | |
| 0 | 4 | 0 | 2 | -17.55 | 123.42 | 16.84 | 225.93 | 0.3861 | -797.0 | -523.5 | |
| 0 | 5 | 0 | 3 | -17.31 | 122.97 | 16.39 | 225.65 | 0.3783 | -1015.0 | -808.1 | |
| 0 | 4 | 0 | 2 | -19.73 | 122.77 | 16.19 | 220.83 | 0.4032 | 625.0 | 548.4 | |
| 0 | 1 | 0 | 0 | -16.34 | 122.07 | 15.49 | 226.08 | 0.3574 | -269.0 | -269.0 | |
| 0 | 3 | 0 | 1 | -19.47 | 119.90 | 13.32 | 216.00 | 0.3711 | -936.0 | -808.1 | |
| 0 | 5 | 0 | 2 | -19.27 | 119.41 | 12.83 | 215.35 | 0.3639 | -1090.0 | -839.0 | |
| 0 | 14 | 0 | 8 | -20.39 | 118.90 | 12.32 | 212.49 | 0.3740 | -1279.0 | -1071.9 | |
| 0 | 3 | 0 | 1 | -20.60 | 118.32 | 11.74 | 210.95 | 0.3718 | -857.0 | -692.4 | |
| 0 | 4 | 0 | 2 | -22.43 | 118.25 | 11.67 | 208.27 | 0.3965 | -583.0 | -393.4 | |
| 0 | 7 | 0 | 4 | -20.56 | 118.01 | 11.43 | 210.37 | 0.3688 | -1182.0 | -917.0 | |
| 0 | 2 | 0 | 1 | -20.35 | 117.49 | 10.91 | 209.51 | 0.3617 | -723.0 | -527.4 | |
| 0 | 4 | 0 | 2 | -20.61 | 117.03 | 10.45 | 208.14 | 0.3616 | 789.0 | 628.2 | |
| 0 | 12 | 0 | 6 | -21.94 | 116.57 | 9.99 | 205.36 | 0.3773 | 1107.0 | 848.9 | |
| 0 | 3 | 0 | 2 | -21.02 | 116.42 | 9.84 | 206.19 | 0.3630 | 557.0 | 575.8 | |
| 0 | 5 | 0 | 3 | -21.61 | 116.29 | 9.71 | 205.15 | 0.3705 | 964.0 | 805.0 | |
| 0 | 3 | 0 | 1 | -21.36 | 116.19 | 9.61 | 205.23 | 0.3662 | 950.0 | 871.7 | |
| 0 | 3 | 0 | 2 | -20.74 | 115.76 | 9.18 | 205.04 | 0.3542 | -97.0 | -72.7 | |
| 0 | 3 | 0 | 2 | -22.41 | 115.61 | 9.03 | 202.70 | 0.3778 | 676.0 | 542.1 | |
| 0 | 4 | 0 | 2 | -19.62 | 115.06 | 8.48 | 204.78 | 0.3330 | 850.0 | 699.3 | |
| 10 | 383 | 5 | 203 | -21.49 | 115.04 | 8.46 | 202.42 | 0.3606 | 1475.8 | 799.3 | |
| 10 | -34 | 5 | -34 | -21.12 | 114.76 | 8.18 | 202.18 | 0.3533 | 1888.9 | 999999 | |
| 21 | -34 | 11 | -34 | -21.91 | 114.38 | 7.80 | 200.39 | 0.3630 | 1722.8 | 999999 | |
| 16 | -34 | 8 | -34 | -21.62 | 114.02 | 7.44 | 199.83 | 0.3566 | 2053.7 | 999999 | |
| 5 | -34 | 3 | -34 | -21.96 | 113.70 | 7.12 | 198.71 | 0.3599 | 1517.6 | 999999 | |
| 0 | 4 | 0 | 2 | -19.22 | 112.90 | 6.32 | 199.47 | 0.3134 | 748.0 | 532.0 | |
| Proj. U | - Projected umbra area in millionths of solar disc, negative values indicate | |
|
that the umbra consists of fragmented regions which cannot be separated without losing umbral area. In this way several spots (intensity minima in the umbra) have a common umbra, e.g. -2 means that the given spot shares an umbra with spot No.2, and the common U value is indicated at spot No.2. |
||
| Proj. WS | - Projected whole spot area in millionths of solar disc, negative values indicate | |
|
that several umbras have a common penumbra, e.g. -7 means that the given umbra shares a penumbra with umbra No.7, and the WS value is indicated at No.7. |
||
| Corr. U | - Corrected umbra area in millionths of solar hemisphere, for negative values see above | |
| Corr. WS | - Corrected whole spot area in millionths of solar hemisphere, for negative values see above | |
| B | - Heliographic latitude B; positive: North, negative: South | |
| L | - Heliographic longitude L | |
| LCM | - Longitudinal distance from the Sun's central meridian | |
| Pos. angle | - Position angle | |
| r | - Distance from the centre of Sun's disc in terms of Sun's radius | |
| MU | - Mean magnetic field within the umbra contour averaged the pixel values with sign. | |
| MP | - Mean magnetic field within the penumbra contour averaged the pixel values with sign. | |