SOHO MDI 1999-05-20 14:09:33 UT
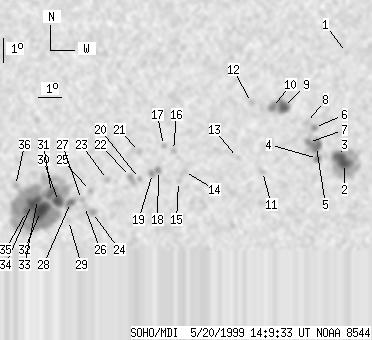
| group | Proj. U | Proj. WS | Corr. U | Corr. WS | B | L | LCM | Pos. angle | r | MU | MP |
| 125 | 663 | 68 | 360 | -20.65 | 118.78 | 13.84 | 213.97 | 0.3993 | 199.8 | 232.3 | |
|
previous
or next observation for the same group /
back to the solar disc SOHO MDI 1999-05-20 14:09:33 UT |
| spot | Proj. U | Proj. WS | Corr. U | Corr. WS | B | L | LCM | Pos. angle | r | MU | MP |
| 0 | 3 | 0 | 2 | -15.32 | 126.95 | 22.00 | 237.40 | 0.4307 | -883.0 | -843.4 | |
| 8 | 101 | 5 | 57 | -19.85 | 127.45 | 22.50 | 229.52 | 0.4752 | -1503.6 | -587.0 | |
| 11 | -2 | 6 | -2 | -19.57 | 127.13 | 22.19 | 229.64 | 0.4689 | -1647.3 | 999999 | |
| 3 | 8 | 2 | 5 | -19.66 | 126.20 | 21.26 | 228.34 | 0.4589 | -1031.0 | -849.6 | |
| 11 | 30 | 6 | 16 | -19.17 | 126.09 | 21.14 | 229.06 | 0.4530 | -1319.6 | -1033.1 | |
| 2 | 9 | 1 | 5 | -18.39 | 125.90 | 20.95 | 230.22 | 0.4434 | -1134.0 | -900.8 | |
| 3 | -5 | 1 | -5 | -19.01 | 125.71 | 20.77 | 228.86 | 0.4470 | -1290.2 | 999999 | |
| 0 | 7 | 0 | 4 | -18.19 | 125.52 | 20.57 | 230.11 | 0.4370 | -716.0 | -881.1 | |
| 10 | 40 | 6 | 22 | -17.55 | 124.43 | 19.49 | 229.87 | 0.4178 | -1402.2 | -1005.6 | |
| 4 | -9 | 2 | -9 | -17.59 | 123.96 | 19.01 | 229.12 | 0.4124 | -1364.2 | 999999 | |
| 0 | 5 | 0 | 3 | -20.23 | 123.83 | 18.88 | 224.16 | 0.4377 | 933.0 | 695.9 | |
| 0 | 6 | 0 | 3 | -17.40 | 123.02 | 18.08 | 228.13 | 0.3993 | -913.0 | -759.1 | |
| 0 | 3 | 0 | 2 | -19.66 | 122.66 | 17.71 | 223.39 | 0.4188 | 694.0 | 722.0 | |
| 0 | 9 | 0 | 5 | -20.26 | 120.41 | 15.46 | 218.66 | 0.4021 | -741.0 | -583.0 | |
| 0 | 3 | 0 | 2 | -20.68 | 120.19 | 15.25 | 217.59 | 0.4050 | -921.0 | -661.9 | |
| 0 | 4 | 0 | 2 | -19.40 | 119.85 | 14.90 | 219.12 | 0.3861 | -987.0 | -882.8 | |
| 0 | 3 | 0 | 2 | -19.20 | 119.40 | 14.45 | 218.64 | 0.3791 | -1043.0 | -799.1 | |
| 2 | 13 | 1 | 7 | -20.23 | 119.28 | 14.33 | 216.67 | 0.3906 | -1268.8 | -968.3 | |
| 4 | -18 | 2 | -18 | -20.36 | 119.03 | 14.09 | 216.00 | 0.3899 | -1184.1 | 999999 | |
| 0 | 4 | 0 | 2 | -20.57 | 118.49 | 13.54 | 214.63 | 0.3875 | -537.0 | -510.0 | |
| 0 | 11 | 0 | 6 | -19.45 | 118.39 | 13.44 | 216.25 | 0.3723 | 927.0 | 501.1 | |
| 0 | 8 | 0 | 4 | -20.49 | 118.09 | 13.15 | 213.98 | 0.3829 | -704.0 | -968.4 | |
| 0 | 4 | 0 | 2 | -20.62 | 117.11 | 12.17 | 211.80 | 0.3760 | 505.0 | 301.4 | |
| 0 | 7 | 0 | 4 | -22.00 | 116.58 | 11.64 | 208.75 | 0.3904 | 1010.0 | 849.0 | |
| 0 | 4 | 0 | 2 | -21.08 | 116.42 | 11.47 | 209.68 | 0.3765 | 598.0 | 462.2 | |
| 0 | 3 | 0 | 2 | -21.75 | 116.21 | 11.27 | 208.33 | 0.3842 | 746.0 | 810.7 | |
| 0 | 4 | 0 | 2 | -21.46 | 116.06 | 11.12 | 208.40 | 0.3789 | 797.0 | 896.7 | |
| 4 | 364 | 2 | 194 | -21.59 | 115.60 | 10.65 | 207.24 | 0.3772 | 1117.8 | 812.3 | |
| 0 | 5 | 0 | 2 | -22.34 | 115.57 | 10.62 | 206.22 | 0.3877 | 667.0 | 422.1 | |
| 11 | -28 | 6 | -28 | -21.55 | 115.08 | 10.13 | 206.16 | 0.3729 | 1410.6 | 999999 | |
| 10 | -28 | 5 | -28 | -21.18 | 114.75 | 9.81 | 205.90 | 0.3652 | 1864.3 | 999999 | |
| 24 | -28 | 13 | -28 | -21.97 | 114.34 | 9.39 | 203.98 | 0.3739 | 1724.0 | 999999 | |
| 5 | -28 | 3 | -28 | -21.47 | 114.17 | 9.23 | 204.21 | 0.3655 | 2213.6 | 999999 | |
| 9 | -28 | 5 | -28 | -21.68 | 113.93 | 8.99 | 203.40 | 0.3670 | 1984.4 | 999999 | |
| 4 | -28 | 2 | -28 | -21.98 | 113.74 | 8.79 | 202.62 | 0.3701 | 1497.4 | 999999 | |
| 0 | 5 | 0 | 3 | -20.89 | 113.20 | 8.26 | 202.60 | 0.3506 | 547.0 | 710.8 | |
| Proj. U | - Projected umbra area in millionths of solar disc, negative values indicate | |
|
that the umbra consists of fragmented regions which cannot be separated without losing umbral area. In this way several spots (intensity minima in the umbra) have a common umbra, e.g. -2 means that the given spot shares an umbra with spot No.2, and the common U value is indicated at spot No.2. |
||
| Proj. WS | - Projected whole spot area in millionths of solar disc, negative values indicate | |
|
that several umbras have a common penumbra, e.g. -7 means that the given umbra shares a penumbra with umbra No.7, and the WS value is indicated at No.7. |
||
| Corr. U | - Corrected umbra area in millionths of solar hemisphere, for negative values see above | |
| Corr. WS | - Corrected whole spot area in millionths of solar hemisphere, for negative values see above | |
| B | - Heliographic latitude B; positive: North, negative: South | |
| L | - Heliographic longitude L | |
| LCM | - Longitudinal distance from the Sun's central meridian | |
| Pos. angle | - Position angle | |
| r | - Distance from the centre of Sun's disc in terms of Sun's radius | |
| MU | - Mean magnetic field within the umbra contour averaged the pixel values with sign. | |
| MP | - Mean magnetic field within the penumbra contour averaged the pixel values with sign. | |