SOHO MDI 1999-05-20 15:59:33 UT
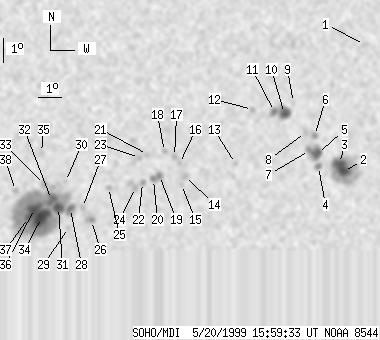
| group | Proj. U | Proj. WS | Corr. U | Corr. WS | B | L | LCM | Pos. angle | r | MU | MP |
| 113 | 672 | 62 | 367 | -20.65 | 118.61 | 14.67 | 215.49 | 0.4067 | 141.9 | 212.0 | |
|
previous
or next observation for the same group /
back to the solar disc SOHO MDI 1999-05-20 15:59:33 UT |
| spot | Proj. U | Proj. WS | Corr. U | Corr. WS | B | L | LCM | Pos. angle | r | MU | MP |
| 0 | 5 | 0 | 3 | -14.72 | 127.68 | 23.75 | 240.38 | 0.4499 | -296.0 | -307.2 | |
| 10 | 104 | 6 | 59 | -19.91 | 127.45 | 23.51 | 230.55 | 0.4877 | -1383.1 | -575.9 | |
| 11 | -2 | 6 | -2 | -19.58 | 127.21 | 23.28 | 230.85 | 0.4821 | -1643.6 | 999999 | |
| 3 | 8 | 2 | 4 | -19.72 | 126.28 | 22.35 | 229.55 | 0.4723 | -1130.3 | -721.3 | |
| 8 | 30 | 5 | 17 | -19.19 | 126.16 | 22.22 | 230.33 | 0.4660 | -1387.8 | -1019.2 | |
| 0 | 5 | 0 | 3 | -18.45 | 125.92 | 21.99 | 231.36 | 0.4566 | -1144.0 | -917.1 | |
| 1 | -5 | 0 | -5 | -19.07 | 125.78 | 21.85 | 230.09 | 0.4605 | -1282.0 | 999999 | |
| 0 | 5 | 0 | 3 | -18.33 | 125.51 | 21.57 | 231.07 | 0.4505 | -1103.0 | -916.2 | |
| 0 | 3 | 0 | 2 | -17.11 | 124.82 | 20.89 | 232.52 | 0.4312 | -814.0 | -699.8 | |
| 11 | 33 | 6 | 18 | -17.57 | 124.48 | 20.54 | 231.22 | 0.4310 | -1379.6 | -1001.9 | |
| 3 | -10 | 2 | -10 | -17.49 | 124.03 | 20.09 | 230.78 | 0.4247 | -1358.0 | 999999 | |
| 0 | 4 | 0 | 2 | -17.42 | 123.06 | 19.12 | 229.60 | 0.4122 | -977.0 | -879.5 | |
| 0 | 3 | 0 | 2 | -19.64 | 122.57 | 18.63 | 224.79 | 0.4289 | 906.0 | 727.8 | |
| 0 | 6 | 0 | 3 | -20.20 | 120.40 | 16.46 | 220.44 | 0.4117 | -1046.0 | -808.3 | |
| 0 | 3 | 0 | 1 | -20.53 | 120.30 | 16.37 | 219.73 | 0.4146 | -625.0 | -468.5 | |
| 0 | 4 | 0 | 2 | -19.67 | 120.12 | 16.19 | 220.89 | 0.4027 | -1028.0 | -812.0 | |
| 0 | 5 | 0 | 3 | -19.38 | 119.87 | 15.94 | 220.97 | 0.3968 | -913.0 | -866.5 | |
| 0 | 4 | 0 | 2 | -19.18 | 119.42 | 15.49 | 220.54 | 0.3897 | -1047.0 | -705.1 | |
| 3 | 17 | 1 | 9 | -20.17 | 119.30 | 15.37 | 218.63 | 0.4002 | -1371.2 | -899.5 | |
| 2 | -19 | 1 | -19 | -20.34 | 119.06 | 15.12 | 217.92 | 0.3998 | -1241.3 | 999999 | |
| 0 | 4 | 0 | 2 | -19.31 | 118.70 | 14.76 | 219.01 | 0.3838 | 371.0 | 323.3 | |
| 0 | 6 | 0 | 3 | -20.47 | 118.59 | 14.66 | 216.87 | 0.3969 | -487.0 | -524.1 | |
| 0 | 3 | 0 | 2 | -19.44 | 118.37 | 14.43 | 218.17 | 0.3819 | 922.0 | 780.2 | |
| 0 | 14 | 0 | 7 | -20.68 | 118.31 | 14.38 | 216.01 | 0.3968 | -1116.0 | -836.7 | |
| 0 | 3 | 0 | 2 | -20.69 | 117.14 | 13.21 | 213.78 | 0.3861 | 482.0 | 554.6 | |
| 0 | 9 | 0 | 5 | -22.07 | 116.53 | 12.60 | 210.57 | 0.3991 | 912.0 | 855.3 | |
| 0 | 5 | 0 | 3 | -21.53 | 116.09 | 12.16 | 210.45 | 0.3883 | 1000.0 | 849.7 | |
| 4 | 364 | 2 | 195 | -21.57 | 115.58 | 11.64 | 209.34 | 0.3847 | 1059.2 | 791.9 | |
| 0 | 3 | 0 | 2 | -22.37 | 115.56 | 11.62 | 208.23 | 0.3955 | 375.0 | 335.1 | |
| 0 | 3 | 0 | 2 | -20.45 | 115.28 | 11.34 | 210.29 | 0.3669 | 802.0 | 707.1 | |
| 10 | -28 | 5 | -28 | -21.53 | 115.06 | 11.12 | 208.30 | 0.3801 | 1352.3 | 999999 | |
| 9 | -28 | 5 | -28 | -21.20 | 114.73 | 10.80 | 208.05 | 0.3730 | 1828.2 | 999999 | |
| 0 | 7 | 0 | 4 | -20.58 | 114.39 | 10.45 | 208.15 | 0.3616 | 1191.0 | 1011.0 | |
| 19 | -28 | 10 | -28 | -21.96 | 114.36 | 10.42 | 206.26 | 0.3809 | 1737.2 | 999999 | |
| 0 | 7 | 0 | 4 | -19.26 | 114.17 | 10.24 | 209.59 | 0.3413 | 116.0 | 262.4 | |
| 14 | -28 | 8 | -28 | -21.58 | 114.03 | 10.09 | 206.01 | 0.3732 | 2139.7 | 999999 | |
| 5 | -28 | 3 | -28 | -21.96 | 113.80 | 9.86 | 205.04 | 0.3770 | 1541.5 | 999999 | |
| 0 | 5 | 0 | 3 | -20.84 | 113.17 | 9.23 | 205.00 | 0.3564 | 834.0 | 720.6 | |
| Proj. U | - Projected umbra area in millionths of solar disc, negative values indicate | |
|
that the umbra consists of fragmented regions which cannot be separated without losing umbral area. In this way several spots (intensity minima in the umbra) have a common umbra, e.g. -2 means that the given spot shares an umbra with spot No.2, and the common U value is indicated at spot No.2. |
||
| Proj. WS | - Projected whole spot area in millionths of solar disc, negative values indicate | |
|
that several umbras have a common penumbra, e.g. -7 means that the given umbra shares a penumbra with umbra No.7, and the WS value is indicated at No.7. |
||
| Corr. U | - Corrected umbra area in millionths of solar hemisphere, for negative values see above | |
| Corr. WS | - Corrected whole spot area in millionths of solar hemisphere, for negative values see above | |
| B | - Heliographic latitude B; positive: North, negative: South | |
| L | - Heliographic longitude L | |
| LCM | - Longitudinal distance from the Sun's central meridian | |
| Pos. angle | - Position angle | |
| r | - Distance from the centre of Sun's disc in terms of Sun's radius | |
| MU | - Mean magnetic field within the umbra contour averaged the pixel values with sign. | |
| MP | - Mean magnetic field within the penumbra contour averaged the pixel values with sign. | |