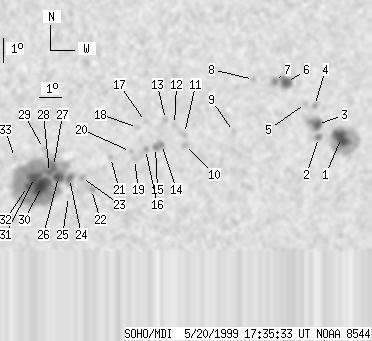
SOHO MDI 1999-05-20 17:35:33 UT
| group | Proj. U | Proj. WS | Corr. U | Corr. WS | B | L | LCM | Pos. angle | r | MU | MP |
| 111 | 617 | 58 | 336 | -20.85 | 118.49 | 15.44 | 216.51 | 0.4161 | 192.0 | 258.4 | |
|
previous
or next observation for the same group /
back to the solar disc SOHO MDI 1999-05-20 17:35:33 UT |
| spot | Proj. U | Proj. WS | Corr. U | Corr. WS | B | L | LCM | Pos. angle | r | MU | MP |
| 22 | 101 | 12 | 57 | -19.85 | 127.29 | 24.23 | 231.42 | 0.4959 | -1518.8 | -519.4 | |
| 3 | 8 | 2 | 5 | -19.87 | 126.24 | 23.19 | 230.25 | 0.4836 | -1024.1 | -755.4 | |
| 9 | 26 | 5 | 15 | -19.33 | 126.11 | 23.06 | 231.02 | 0.4774 | -1311.8 | -1062.3 | |
| 0 | 5 | 0 | 3 | -18.55 | 125.86 | 22.81 | 232.11 | 0.4676 | -1137.0 | -870.7 | |
| 0 | 4 | 0 | 2 | -18.48 | 125.45 | 22.39 | 231.77 | 0.4619 | -949.0 | -870.3 | |
| 10 | 30 | 5 | 17 | -17.63 | 124.49 | 21.44 | 232.20 | 0.4427 | -1347.2 | -1039.5 | |
| 2 | -6 | 1 | -6 | -17.60 | 123.95 | 20.90 | 231.60 | 0.4357 | -1343.2 | 999999 | |
| 0 | 3 | 0 | 2 | -17.53 | 123.02 | 19.97 | 230.53 | 0.4236 | -892.0 | -871.6 | |
| 0 | 4 | 0 | 2 | -19.67 | 122.40 | 19.34 | 225.75 | 0.4373 | 777.0 | 609.2 | |
| 0 | 6 | 0 | 3 | -20.23 | 120.35 | 17.30 | 221.73 | 0.4209 | -998.0 | -738.9 | |
| 0 | 5 | 0 | 3 | -19.77 | 120.25 | 17.20 | 222.36 | 0.4148 | -869.0 | -865.7 | |
| 0 | 3 | 0 | 1 | -19.41 | 119.78 | 16.72 | 222.23 | 0.4055 | -800.0 | -797.5 | |
| 0 | 6 | 0 | 3 | -19.21 | 119.37 | 16.31 | 221.90 | 0.3988 | -787.0 | -716.2 | |
| 2 | 15 | 1 | 8 | -20.24 | 119.30 | 16.25 | 220.01 | 0.4100 | -1281.0 | -936.8 | |
| 2 | -14 | 1 | -14 | -20.37 | 119.05 | 16.00 | 219.38 | 0.4090 | -1194.4 | 999999 | |
| 0 | 4 | 0 | 2 | -20.45 | 118.63 | 15.57 | 218.50 | 0.4057 | -647.0 | -607.2 | |
| 0 | 3 | 0 | 2 | -19.30 | 118.51 | 15.45 | 220.26 | 0.3908 | 469.0 | 429.2 | |
| 0 | 3 | 0 | 2 | -19.55 | 118.19 | 15.13 | 219.26 | 0.3905 | 895.0 | 810.9 | |
| 0 | 3 | 0 | 2 | -20.87 | 118.19 | 15.14 | 217.06 | 0.4065 | -694.0 | -773.1 | |
| 0 | 3 | 0 | 2 | -20.54 | 117.98 | 14.93 | 217.22 | 0.4005 | -870.0 | -706.0 | |
| 0 | 4 | 0 | 2 | -20.80 | 117.14 | 14.08 | 215.27 | 0.3956 | 816.0 | 550.0 | |
| 0 | 10 | 0 | 5 | -22.14 | 116.44 | 13.39 | 211.97 | 0.4068 | 880.0 | 762.7 | |
| 0 | 6 | 0 | 3 | -21.64 | 115.96 | 12.90 | 211.76 | 0.3961 | 1033.0 | 857.1 | |
| 4 | 354 | 2 | 190 | -21.69 | 115.44 | 12.39 | 210.68 | 0.3924 | 1169.0 | 799.2 | |
| 0 | 3 | 0 | 1 | -22.44 | 115.47 | 12.41 | 209.69 | 0.4028 | 551.0 | 472.8 | |
| 8 | -24 | 4 | -24 | -21.61 | 114.96 | 11.91 | 209.82 | 0.3874 | 1391.4 | 999999 | |
| 6 | -24 | 3 | -24 | -21.19 | 114.71 | 11.66 | 209.88 | 0.3797 | 1698.7 | 999999 | |
| 3 | -24 | 1 | -24 | -21.44 | 114.56 | 11.50 | 209.22 | 0.3819 | 1953.3 | 999999 | |
| 0 | 5 | 0 | 2 | -20.45 | 114.22 | 11.17 | 209.92 | 0.3655 | 1053.0 | 846.6 | |
| 23 | -24 | 12 | -24 | -22.03 | 114.26 | 11.21 | 207.81 | 0.3878 | 1692.0 | 999999 | |
| 13 | -24 | 7 | -24 | -21.65 | 113.93 | 10.87 | 207.60 | 0.3801 | 2156.5 | 999999 | |
| 4 | -24 | 2 | -24 | -22.03 | 113.66 | 10.60 | 206.53 | 0.3834 | 1557.6 | 999999 | |
| 0 | 3 | 0 | 2 | -20.83 | 113.01 | 9.96 | 206.68 | 0.3615 | 872.0 | 710.8 | |
| Proj. U | - Projected umbra area in millionths of solar disc, negative values indicate | |
|
that the umbra consists of fragmented regions which cannot be separated without losing umbral area. In this way several spots (intensity minima in the umbra) have a common umbra, e.g. -2 means that the given spot shares an umbra with spot No.2, and the common U value is indicated at spot No.2. |
||
| Proj. WS | - Projected whole spot area in millionths of solar disc, negative values indicate | |
|
that several umbras have a common penumbra, e.g. -7 means that the given umbra shares a penumbra with umbra No.7, and the WS value is indicated at No.7. |
||
| Corr. U | - Corrected umbra area in millionths of solar hemisphere, for negative values see above | |
| Corr. WS | - Corrected whole spot area in millionths of solar hemisphere, for negative values see above | |
| B | - Heliographic latitude B; positive: North, negative: South | |
| L | - Heliographic longitude L | |
| LCM | - Longitudinal distance from the Sun's central meridian | |
| Pos. angle | - Position angle | |
| r | - Distance from the centre of Sun's disc in terms of Sun's radius | |
| MU | - Mean magnetic field within the umbra contour averaged the pixel values with sign. | |
| MP | - Mean magnetic field within the penumbra contour averaged the pixel values with sign. | |