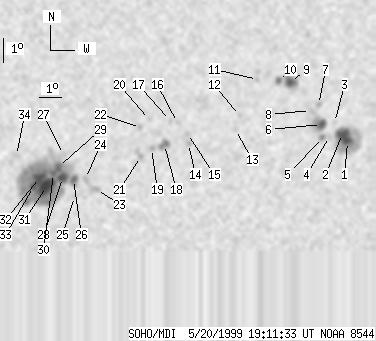
SOHO MDI 1999-05-20 19:11:33 UT
| group | Proj. U | Proj. WS | Corr. U | Corr. WS | B | L | LCM | Pos. angle | r | MU | MP |
| 113 | 608 | 62 | 336 | -20.75 | 118.66 | 16.49 | 218.46 | 0.4250 | 150.9 | 258.9 | |
|
previous
or next observation for the same group /
back to the solar disc SOHO MDI 1999-05-20 19:11:33 UT |
| spot | Proj. U | Proj. WS | Corr. U | Corr. WS | B | L | LCM | Pos. angle | r | MU | MP |
| 8 | 95 | 4 | 55 | -19.95 | 127.53 | 25.36 | 232.40 | 0.5101 | -1294.8 | -520.0 | |
| 14 | -1 | 8 | -1 | -19.63 | 127.24 | 25.07 | 232.65 | 0.5041 | -1575.1 | 999999 | |
| 0 | 4 | 0 | 2 | -19.18 | 126.80 | 24.63 | 232.96 | 0.4951 | -527.0 | -356.0 | |
| 0 | 3 | 0 | 1 | -19.76 | 126.67 | 24.49 | 231.84 | 0.4982 | -875.0 | -837.4 | |
| 3 | 6 | 1 | 3 | -19.80 | 126.35 | 24.18 | 231.43 | 0.4949 | -1130.8 | -818.7 | |
| 9 | 27 | 5 | 15 | -19.27 | 126.22 | 24.05 | 232.20 | 0.4888 | -1325.0 | -994.2 | |
| 0 | 5 | 0 | 3 | -18.45 | 125.96 | 23.79 | 233.35 | 0.4788 | -947.0 | -798.7 | |
| 0 | 7 | 0 | 4 | -18.70 | 125.63 | 23.46 | 232.56 | 0.4769 | -906.0 | -774.8 | |
| 10 | 32 | 5 | 18 | -17.53 | 124.57 | 22.40 | 233.51 | 0.4539 | -1336.1 | -923.2 | |
| 3 | -9 | 2 | -9 | -17.49 | 124.03 | 21.86 | 232.95 | 0.4468 | -1311.6 | 999999 | |
| 0 | 3 | 0 | 2 | -17.47 | 123.10 | 20.93 | 231.87 | 0.4350 | -988.0 | -756.1 | |
| 0 | 3 | 0 | 2 | -18.95 | 122.49 | 20.31 | 228.34 | 0.4414 | 357.0 | 156.6 | |
| 0 | 3 | 0 | 2 | -19.53 | 122.38 | 20.21 | 227.18 | 0.4458 | 735.0 | 623.0 | |
| 0 | 5 | 0 | 3 | -20.13 | 120.38 | 18.21 | 223.30 | 0.4296 | -1053.0 | -794.4 | |
| 0 | 3 | 0 | 2 | -19.72 | 120.29 | 18.11 | 223.87 | 0.4241 | -1012.0 | -921.6 | |
| 0 | 3 | 0 | 2 | -19.27 | 119.80 | 17.62 | 223.91 | 0.4139 | -615.0 | -809.7 | |
| 0 | 4 | 0 | 2 | -19.19 | 119.48 | 17.31 | 223.55 | 0.4096 | -1064.0 | -811.8 | |
| 7 | 15 | 4 | 8 | -20.18 | 119.33 | 17.16 | 221.58 | 0.4189 | -1245.4 | -826.9 | |
| 0 | 3 | 0 | 2 | -20.35 | 118.78 | 16.61 | 220.41 | 0.4151 | -938.0 | -795.2 | |
| 0 | 4 | 0 | 2 | -19.16 | 118.56 | 16.39 | 222.12 | 0.3992 | 594.0 | 441.5 | |
| 0 | 9 | 0 | 5 | -20.69 | 118.34 | 16.16 | 219.12 | 0.4145 | -878.0 | -672.9 | |
| 0 | 3 | 0 | 2 | -19.49 | 118.21 | 16.04 | 220.93 | 0.3992 | 964.0 | 761.3 | |
| 0 | 8 | 0 | 5 | -22.08 | 116.56 | 14.39 | 213.88 | 0.4148 | 954.0 | 786.7 | |
| 0 | 5 | 0 | 3 | -21.62 | 116.03 | 13.86 | 213.58 | 0.4043 | 1028.0 | 875.0 | |
| 0 | 4 | 0 | 2 | -22.38 | 115.63 | 13.45 | 211.75 | 0.4106 | 635.0 | 485.8 | |
| 4 | 340 | 2 | 183 | -21.67 | 115.51 | 13.34 | 212.54 | 0.4003 | 1093.0 | 824.1 | |
| 0 | 5 | 0 | 3 | -20.63 | 114.99 | 12.81 | 213.06 | 0.3821 | 826.0 | 807.4 | |
| 8 | -26 | 5 | -26 | -21.59 | 115.03 | 12.86 | 211.72 | 0.3951 | 1326.0 | 999999 | |
| 6 | -26 | 3 | -26 | -21.13 | 114.81 | 12.64 | 211.97 | 0.3872 | 1638.1 | 999999 | |
| 1 | -26 | 1 | -26 | -21.43 | 114.62 | 12.45 | 211.16 | 0.3895 | 1915.1 | 999999 | |
| 23 | -26 | 13 | -26 | -21.97 | 114.37 | 12.20 | 209.89 | 0.3948 | 1695.5 | 999999 | |
| 12 | -26 | 6 | -26 | -21.60 | 114.03 | 11.86 | 209.73 | 0.3870 | 2194.3 | 999999 | |
| 5 | -26 | 3 | -26 | -21.98 | 113.81 | 11.63 | 208.75 | 0.3904 | 1555.0 | 999999 | |
| 0 | 9 | 0 | 5 | -20.69 | 112.97 | 10.80 | 208.75 | 0.3661 | 390.0 | 242.8 | |
| Proj. U | - Projected umbra area in millionths of solar disc, negative values indicate | |
|
that the umbra consists of fragmented regions which cannot be separated without losing umbral area. In this way several spots (intensity minima in the umbra) have a common umbra, e.g. -2 means that the given spot shares an umbra with spot No.2, and the common U value is indicated at spot No.2. |
||
| Proj. WS | - Projected whole spot area in millionths of solar disc, negative values indicate | |
|
that several umbras have a common penumbra, e.g. -7 means that the given umbra shares a penumbra with umbra No.7, and the WS value is indicated at No.7. |
||
| Corr. U | - Corrected umbra area in millionths of solar hemisphere, for negative values see above | |
| Corr. WS | - Corrected whole spot area in millionths of solar hemisphere, for negative values see above | |
| B | - Heliographic latitude B; positive: North, negative: South | |
| L | - Heliographic longitude L | |
| LCM | - Longitudinal distance from the Sun's central meridian | |
| Pos. angle | - Position angle | |
| r | - Distance from the centre of Sun's disc in terms of Sun's radius | |
| MU | - Mean magnetic field within the umbra contour averaged the pixel values with sign. | |
| MP | - Mean magnetic field within the penumbra contour averaged the pixel values with sign. | |