SOHO MDI 1999-05-20 20:47:33 UT
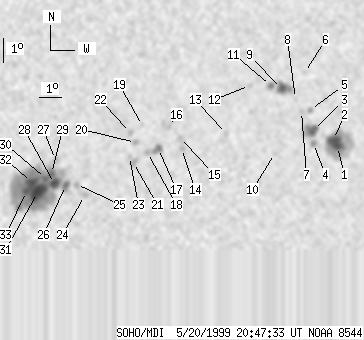
| group | Proj. U | Proj. WS | Corr. U | Corr. WS | B | L | LCM | Pos. angle | r | MU | MP |
| 104 | 575 | 58 | 317 | -20.65 | 119.09 | 17.80 | 220.71 | 0.4371 | 191.8 | 170.2 | |
|
previous
or next observation for the same group /
back to the solar disc SOHO MDI 1999-05-20 20:47:33 UT |
| spot | Proj. U | Proj. WS | Corr. U | Corr. WS | B | L | LCM | Pos. angle | r | MU | MP |
| 6 | 99 | 4 | 57 | -19.94 | 127.49 | 26.19 | 233.23 | 0.5201 | -1405.8 | -550.0 | |
| 13 | -1 | 8 | -1 | -19.65 | 127.25 | 25.96 | 233.48 | 0.5150 | -1621.8 | 999999 | |
| 9 | 28 | 5 | 16 | -19.29 | 126.26 | 24.97 | 233.11 | 0.5002 | -1354.3 | -963.7 | |
| 0 | 6 | 0 | 3 | -19.83 | 126.35 | 25.06 | 232.30 | 0.5057 | -1190.0 | -1024.8 | |
| 0 | 4 | 0 | 2 | -18.43 | 125.99 | 24.70 | 234.32 | 0.4900 | -969.0 | -840.1 | |
| 0 | 3 | 0 | 2 | -16.93 | 125.50 | 24.21 | 236.54 | 0.4721 | -469.0 | -402.2 | |
| 0 | 4 | 0 | 2 | -18.52 | 125.59 | 24.30 | 233.76 | 0.4858 | -795.0 | -777.8 | |
| 0 | 3 | 0 | 2 | -17.99 | 125.24 | 23.95 | 234.33 | 0.4772 | -395.0 | -438.1 | |
| 8 | 26 | 4 | 14 | -17.59 | 124.55 | 23.26 | 234.33 | 0.4653 | -1416.7 | -804.6 | |
| 0 | 4 | 0 | 2 | -20.27 | 124.63 | 23.34 | 229.73 | 0.4891 | -528.0 | -546.8 | |
| 3 | 8 | 2 | 4 | -17.48 | 124.05 | 22.75 | 233.99 | 0.4580 | -1181.4 | -774.4 | |
| 0 | 4 | 0 | 2 | -17.49 | 123.11 | 21.82 | 232.89 | 0.4464 | -854.0 | -612.2 | |
| 0 | 5 | 0 | 3 | -19.47 | 122.35 | 21.05 | 228.36 | 0.4551 | 900.0 | 693.7 | |
| 0 | 4 | 0 | 2 | -20.11 | 120.43 | 19.14 | 224.67 | 0.4397 | -1044.0 | -874.1 | |
| 0 | 9 | 0 | 5 | -19.66 | 120.33 | 19.04 | 225.31 | 0.4339 | -873.0 | -765.8 | |
| 0 | 12 | 0 | 7 | -19.21 | 119.74 | 18.45 | 225.25 | 0.4226 | -855.0 | -724.8 | |
| 4 | 12 | 2 | 7 | -20.12 | 119.41 | 18.12 | 223.16 | 0.4287 | -1261.4 | -1033.4 | |
| 0 | 4 | 0 | 2 | -20.29 | 118.95 | 17.66 | 222.16 | 0.4256 | -1040.0 | -907.9 | |
| 0 | 3 | 0 | 2 | -19.18 | 118.60 | 17.31 | 223.55 | 0.4096 | 695.0 | 523.7 | |
| 0 | 5 | 0 | 3 | -19.89 | 118.37 | 17.08 | 221.96 | 0.4149 | 500.0 | 471.8 | |
| 0 | 6 | 0 | 3 | -20.71 | 118.38 | 17.09 | 220.57 | 0.4244 | -984.0 | -813.2 | |
| 0 | 3 | 0 | 2 | -19.48 | 118.11 | 16.82 | 222.24 | 0.4075 | 996.0 | 781.7 | |
| 0 | 3 | 0 | 2 | -20.47 | 118.18 | 16.89 | 220.66 | 0.4195 | -712.0 | -504.2 | |
| 0 | 5 | 0 | 3 | -22.11 | 116.39 | 15.09 | 215.07 | 0.4216 | 819.0 | 723.4 | |
| 0 | 4 | 0 | 2 | -21.65 | 115.99 | 14.69 | 215.05 | 0.4123 | 1051.0 | 830.1 | |
| 5 | 305 | 3 | 165 | -21.70 | 115.51 | 14.22 | 214.12 | 0.4085 | 1198.1 | 837.4 | |
| 0 | 6 | 0 | 3 | -20.62 | 114.97 | 13.68 | 214.76 | 0.3899 | 890.0 | 784.6 | |
| 8 | -26 | 4 | -26 | -21.62 | 115.02 | 13.73 | 213.34 | 0.4032 | 1321.3 | 999999 | |
| 4 | -26 | 2 | -26 | -21.20 | 114.85 | 13.56 | 213.64 | 0.3963 | 1636.2 | 999999 | |
| 3 | -26 | 2 | -26 | -21.41 | 114.61 | 13.32 | 212.87 | 0.3969 | 1774.3 | 999999 | |
| 24 | -26 | 13 | -26 | -22.00 | 114.32 | 13.03 | 211.46 | 0.4021 | 1686.7 | 999999 | |
| 11 | -26 | 6 | -26 | -21.59 | 114.02 | 12.73 | 211.47 | 0.3941 | 2184.3 | 999999 | |
| 6 | -26 | 3 | -26 | -21.96 | 113.84 | 12.55 | 210.58 | 0.3976 | 1668.7 | 999999 | |
| Proj. U | - Projected umbra area in millionths of solar disc, negative values indicate | |
|
that the umbra consists of fragmented regions which cannot be separated without losing umbral area. In this way several spots (intensity minima in the umbra) have a common umbra, e.g. -2 means that the given spot shares an umbra with spot No.2, and the common U value is indicated at spot No.2. |
||
| Proj. WS | - Projected whole spot area in millionths of solar disc, negative values indicate | |
|
that several umbras have a common penumbra, e.g. -7 means that the given umbra shares a penumbra with umbra No.7, and the WS value is indicated at No.7. |
||
| Corr. U | - Corrected umbra area in millionths of solar hemisphere, for negative values see above | |
| Corr. WS | - Corrected whole spot area in millionths of solar hemisphere, for negative values see above | |
| B | - Heliographic latitude B; positive: North, negative: South | |
| L | - Heliographic longitude L | |
| LCM | - Longitudinal distance from the Sun's central meridian | |
| Pos. angle | - Position angle | |
| r | - Distance from the centre of Sun's disc in terms of Sun's radius | |
| MU | - Mean magnetic field within the umbra contour averaged the pixel values with sign. | |
| MP | - Mean magnetic field within the penumbra contour averaged the pixel values with sign. | |