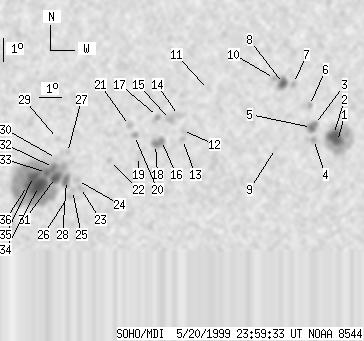
SOHO MDI 1999-05-20 23:59:33 UT
| group | Proj. U | Proj. WS | Corr. U | Corr. WS | B | L | LCM | Pos. angle | r | MU | MP |
| 104 | 592 | 56 | 326 | -20.83 | 118.67 | 19.14 | 222.45 | 0.4524 | 263.5 | 215.3 | |
|
previous
or next observation for the same group /
back to the solar disc SOHO MDI 1999-05-20 23:59:33 UT |
| spot | Proj. U | Proj. WS | Corr. U | Corr. WS | B | L | LCM | Pos. angle | r | MU | MP |
| 6 | 105 | 3 | 61 | -19.97 | 127.56 | 28.03 | 234.81 | 0.5426 | -1275.2 | -473.9 | |
| 12 | -1 | 7 | -1 | -19.69 | 127.32 | 27.79 | 235.06 | 0.5376 | -1595.4 | 999999 | |
| 2 | 16 | 1 | 9 | -19.29 | 126.35 | 26.82 | 234.86 | 0.5229 | -1042.0 | -1008.8 | |
| 0 | 10 | 0 | 6 | -19.91 | 126.42 | 26.89 | 233.90 | 0.5283 | -879.0 | -762.9 | |
| 5 | -3 | 3 | -3 | -19.42 | 126.23 | 26.70 | 234.54 | 0.5224 | -1387.8 | 999999 | |
| 0 | 4 | 0 | 2 | -18.52 | 125.98 | 26.46 | 235.83 | 0.5126 | -1065.0 | -800.4 | |
| 0 | 4 | 0 | 2 | -17.63 | 125.10 | 25.58 | 236.57 | 0.4950 | -936.0 | -662.9 | |
| 8 | 15 | 5 | 8 | -17.63 | 124.65 | 25.12 | 236.12 | 0.4893 | -1244.8 | -803.6 | |
| 0 | 4 | 0 | 2 | -20.31 | 124.71 | 25.19 | 231.61 | 0.5113 | -640.0 | -676.0 | |
| 0 | 5 | 0 | 3 | -17.44 | 124.21 | 24.68 | 236.05 | 0.4822 | -1328.0 | -1012.7 | |
| 0 | 3 | 0 | 1 | -17.92 | 121.31 | 21.78 | 232.01 | 0.4498 | -419.0 | -242.5 | |
| 0 | 5 | 0 | 3 | -19.62 | 120.38 | 20.85 | 227.81 | 0.4543 | -1001.0 | -776.8 | |
| 0 | 4 | 0 | 2 | -19.99 | 120.43 | 20.90 | 227.24 | 0.4585 | -705.0 | -645.7 | |
| 0 | 8 | 0 | 4 | -19.01 | 120.12 | 20.59 | 228.56 | 0.4454 | -877.0 | -617.6 | |
| 0 | 11 | 0 | 6 | -19.18 | 119.78 | 20.25 | 227.82 | 0.4431 | -1145.0 | -943.2 | |
| 3 | 19 | 2 | 11 | -20.05 | 119.50 | 19.97 | 225.92 | 0.4485 | -1155.0 | -922.8 | |
| 0 | 5 | 0 | 3 | -19.06 | 119.19 | 19.66 | 227.23 | 0.4351 | -947.0 | -533.1 | |
| 3 | -16 | 2 | -16 | -20.21 | 119.25 | 19.72 | 225.29 | 0.4474 | -1288.5 | 999999 | |
| 0 | 8 | 0 | 5 | -20.72 | 118.56 | 19.03 | 223.48 | 0.4452 | -678.0 | -638.0 | |
| 0 | 5 | 0 | 3 | -19.85 | 118.27 | 18.75 | 224.53 | 0.4328 | 731.0 | 511.9 | |
| 0 | 5 | 0 | 3 | -19.44 | 118.00 | 18.48 | 224.85 | 0.4255 | 944.0 | 722.0 | |
| 0 | 5 | 0 | 3 | -20.90 | 117.30 | 17.77 | 221.31 | 0.4337 | 259.0 | 306.3 | |
| 0 | 6 | 0 | 3 | -22.04 | 116.15 | 16.63 | 217.72 | 0.4354 | 786.0 | 764.3 | |
| 0 | 7 | 0 | 4 | -21.75 | 115.99 | 16.46 | 217.89 | 0.4303 | 842.0 | 701.9 | |
| 0 | 2 | 0 | 1 | -22.17 | 115.82 | 16.29 | 216.97 | 0.4337 | 920.0 | 828.8 | |
| 0 | 5 | 0 | 2 | -22.38 | 115.66 | 16.14 | 216.41 | 0.4348 | 689.0 | 654.6 | |
| 0 | 4 | 0 | 2 | -20.59 | 115.42 | 15.89 | 218.79 | 0.4109 | 908.0 | 673.7 | |
| 6 | 318 | 3 | 173 | -21.75 | 115.50 | 15.97 | 217.09 | 0.4257 | 1063.3 | 792.9 | |
| 0 | 4 | 0 | 2 | -20.01 | 114.92 | 15.39 | 218.88 | 0.3990 | 756.0 | 530.2 | |
| 0 | 5 | 0 | 2 | -20.84 | 114.96 | 15.43 | 217.60 | 0.4094 | 922.0 | 826.9 | |
| 8 | -28 | 4 | -28 | -21.63 | 115.00 | 15.48 | 216.43 | 0.4195 | 1333.5 | 999999 | |
| 4 | -28 | 2 | -28 | -21.21 | 114.87 | 15.34 | 216.84 | 0.4131 | 1570.7 | 999999 | |
| 3 | -28 | 1 | -28 | -21.43 | 114.59 | 15.06 | 216.02 | 0.4130 | 1827.2 | 999999 | |
| 27 | -28 | 15 | -28 | -22.01 | 114.30 | 14.77 | 214.63 | 0.4177 | 1669.5 | 999999 | |
| 12 | -28 | 6 | -28 | -21.60 | 114.04 | 14.51 | 214.78 | 0.4101 | 2146.5 | 999999 | |
| 5 | -28 | 2 | -28 | -21.98 | 113.81 | 14.29 | 213.82 | 0.4129 | 1656.2 | 999999 | |
| Proj. U | - Projected umbra area in millionths of solar disc, negative values indicate | |
|
that the umbra consists of fragmented regions which cannot be separated without losing umbral area. In this way several spots (intensity minima in the umbra) have a common umbra, e.g. -2 means that the given spot shares an umbra with spot No.2, and the common U value is indicated at spot No.2. |
||
| Proj. WS | - Projected whole spot area in millionths of solar disc, negative values indicate | |
|
that several umbras have a common penumbra, e.g. -7 means that the given umbra shares a penumbra with umbra No.7, and the WS value is indicated at No.7. |
||
| Corr. U | - Corrected umbra area in millionths of solar hemisphere, for negative values see above | |
| Corr. WS | - Corrected whole spot area in millionths of solar hemisphere, for negative values see above | |
| B | - Heliographic latitude B; positive: North, negative: South | |
| L | - Heliographic longitude L | |
| LCM | - Longitudinal distance from the Sun's central meridian | |
| Pos. angle | - Position angle | |
| r | - Distance from the centre of Sun's disc in terms of Sun's radius | |
| MU | - Mean magnetic field within the umbra contour averaged the pixel values with sign. | |
| MP | - Mean magnetic field within the penumbra contour averaged the pixel values with sign. | |