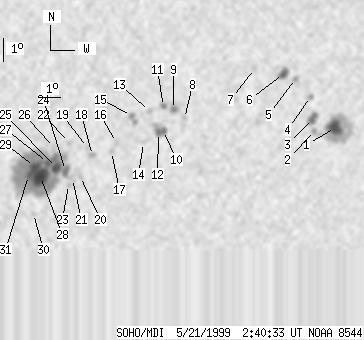
SOHO MDI 1999-05-21 02:40:33 UT
| group | Proj. U | Proj. WS | Corr. U | Corr. WS | B | L | LCM | Pos. angle | r | MU | MP |
| 102 | 604 | 58 | 340 | -20.89 | 118.52 | 20.47 | 224.22 | 0.4672 | 197.0 | 268.5 | |
|
previous
or next observation for the same group /
back to the solar disc SOHO MDI 1999-05-21 02:40:33 UT |
| spot | Proj. U | Proj. WS | Corr. U | Corr. WS | B | L | LCM | Pos. angle | r | MU | MP |
| 19 | 101 | 11 | 60 | -19.82 | 127.49 | 29.44 | 236.21 | 0.5585 | -1452.3 | -443.1 | |
| 0 | 10 | 0 | 6 | -19.96 | 126.51 | 28.46 | 235.18 | 0.5477 | -947.0 | -707.1 | |
| 8 | 17 | 5 | 10 | -19.46 | 126.32 | 28.27 | 235.82 | 0.5419 | -1302.2 | -813.1 | |
| 0 | 6 | 0 | 3 | -18.56 | 126.06 | 28.01 | 237.08 | 0.5324 | -1110.0 | -912.6 | |
| 0 | 5 | 0 | 3 | -17.84 | 125.23 | 27.18 | 237.62 | 0.5170 | -598.0 | -573.1 | |
| 8 | 17 | 5 | 10 | -17.64 | 124.64 | 26.59 | 237.45 | 0.5081 | -1208.6 | -793.2 | |
| 0 | 5 | 0 | 3 | -17.46 | 123.28 | 25.23 | 236.53 | 0.4895 | -674.0 | -593.4 | |
| 0 | 5 | 0 | 3 | -19.55 | 120.42 | 22.37 | 229.79 | 0.4715 | -856.0 | -795.9 | |
| 4 | 11 | 2 | 6 | -19.19 | 119.87 | 21.82 | 229.77 | 0.4617 | -1192.0 | -915.8 | |
| 3 | 23 | 2 | 13 | -20.06 | 119.54 | 21.49 | 227.86 | 0.4661 | -1077.2 | -955.1 | |
| 2 | 7 | 1 | 4 | -19.07 | 119.41 | 21.36 | 229.40 | 0.4551 | -947.0 | -579.8 | |
| 3 | -10 | 2 | -10 | -20.14 | 119.33 | 21.28 | 227.45 | 0.4645 | -1275.1 | 999999 | |
| 0 | 4 | 0 | 2 | -19.28 | 118.81 | 20.76 | 228.27 | 0.4502 | 213.0 | 188.1 | |
| 0 | 3 | 0 | 2 | -20.57 | 118.72 | 20.67 | 225.95 | 0.4617 | -907.0 | -717.4 | |
| 0 | 13 | 0 | 7 | -19.46 | 118.03 | 19.98 | 226.94 | 0.4429 | 1262.0 | 729.5 | |
| 0 | 5 | 0 | 3 | -20.58 | 117.51 | 19.46 | 224.30 | 0.4485 | -821.0 | -507.0 | |
| 0 | 5 | 0 | 3 | -20.96 | 117.34 | 19.29 | 223.43 | 0.4506 | 333.0 | 221.3 | |
| 0 | 6 | 0 | 3 | -21.13 | 116.52 | 18.47 | 221.96 | 0.4437 | 721.0 | 570.5 | |
| 0 | 3 | 0 | 2 | -20.80 | 116.25 | 18.20 | 222.11 | 0.4373 | 463.0 | 408.5 | |
| 0 | 4 | 0 | 2 | -22.01 | 116.10 | 18.05 | 219.94 | 0.4492 | 656.0 | 694.4 | |
| 0 | 6 | 0 | 3 | -22.10 | 115.75 | 17.70 | 219.29 | 0.4468 | 795.0 | 758.6 | |
| 0 | 4 | 0 | 2 | -20.60 | 115.43 | 17.38 | 221.18 | 0.4265 | 972.0 | 798.0 | |
| 0 | 3 | 0 | 2 | -22.35 | 115.61 | 17.56 | 218.68 | 0.4482 | 716.0 | 521.1 | |
| 5 | 335 | 3 | 184 | -21.77 | 115.40 | 17.35 | 219.25 | 0.4394 | 908.1 | 765.0 | |
| 9 | -24 | 5 | -24 | -21.65 | 114.98 | 16.93 | 218.79 | 0.4339 | 1320.8 | 999999 | |
| 0 | 1 | 0 | 1 | -20.82 | 114.80 | 16.75 | 219.82 | 0.4224 | 1111.0 | 849.3 | |
| 4 | -24 | 2 | -24 | -21.44 | 114.56 | 16.51 | 218.43 | 0.4274 | 1766.8 | 999999 | |
| 22 | -24 | 12 | -24 | -22.03 | 114.32 | 16.27 | 217.14 | 0.4320 | 1731.9 | 999999 | |
| 9 | -24 | 5 | -24 | -21.62 | 114.01 | 15.96 | 217.25 | 0.4240 | 2182.7 | 999999 | |
| 0 | 5 | 0 | 3 | -23.59 | 114.20 | 16.15 | 214.69 | 0.4499 | 757.0 | 480.0 | |
| 6 | -24 | 3 | -24 | -21.99 | 113.79 | 15.74 | 216.31 | 0.4265 | 1629.7 | 999999 | |
| Proj. U | - Projected umbra area in millionths of solar disc, negative values indicate | |
|
that the umbra consists of fragmented regions which cannot be separated without losing umbral area. In this way several spots (intensity minima in the umbra) have a common umbra, e.g. -2 means that the given spot shares an umbra with spot No.2, and the common U value is indicated at spot No.2. |
||
| Proj. WS | - Projected whole spot area in millionths of solar disc, negative values indicate | |
|
that several umbras have a common penumbra, e.g. -7 means that the given umbra shares a penumbra with umbra No.7, and the WS value is indicated at No.7. |
||
| Corr. U | - Corrected umbra area in millionths of solar hemisphere, for negative values see above | |
| Corr. WS | - Corrected whole spot area in millionths of solar hemisphere, for negative values see above | |
| B | - Heliographic latitude B; positive: North, negative: South | |
| L | - Heliographic longitude L | |
| LCM | - Longitudinal distance from the Sun's central meridian | |
| Pos. angle | - Position angle | |
| r | - Distance from the centre of Sun's disc in terms of Sun's radius | |
| MU | - Mean magnetic field within the umbra contour averaged the pixel values with sign. | |
| MP | - Mean magnetic field within the penumbra contour averaged the pixel values with sign. | |