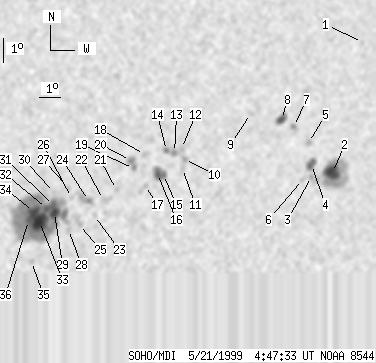
SOHO MDI 1999-05-21 04:47:33 UT
| group | Proj. U | Proj. WS | Corr. U | Corr. WS | B | L | LCM | Pos. angle | r | MU | MP |
| 105 | 619 | 59 | 349 | -20.84 | 118.52 | 21.64 | 225.85 | 0.4792 | 85.1 | 289.6 | |
|
previous
or next observation for the same group /
back to the solar disc SOHO MDI 1999-05-21 04:47:33 UT |
| spot | Proj. U | Proj. WS | Corr. U | Corr. WS | B | L | LCM | Pos. angle | r | MU | MP |
| 0 | 3 | 0 | 2 | -14.51 | 127.94 | 31.06 | 246.14 | 0.5482 | -662.0 | -495.5 | |
| 21 | 96 | 13 | 58 | -19.83 | 127.49 | 30.60 | 237.07 | 0.5727 | -1428.4 | -423.1 | |
| 0 | 9 | 0 | 5 | -20.01 | 126.51 | 29.62 | 236.03 | 0.5622 | -1074.0 | -678.2 | |
| 9 | 15 | 5 | 9 | -19.52 | 126.41 | 29.52 | 236.74 | 0.5576 | -1259.3 | -846.8 | |
| 0 | 4 | 0 | 2 | -18.62 | 126.09 | 29.20 | 237.94 | 0.5477 | -1034.0 | -912.5 | |
| 0 | 4 | 0 | 2 | -20.14 | 126.10 | 29.22 | 235.50 | 0.5582 | -741.0 | -571.2 | |
| 0 | 4 | 0 | 2 | -17.97 | 125.26 | 28.38 | 238.36 | 0.5331 | -710.0 | -519.8 | |
| 8 | 15 | 4 | 9 | -17.70 | 124.65 | 27.76 | 238.33 | 0.5235 | -1103.3 | -655.8 | |
| 0 | 4 | 0 | 3 | -17.47 | 123.18 | 26.29 | 237.46 | 0.5032 | -889.0 | -657.0 | |
| 0 | 7 | 0 | 4 | -19.40 | 120.46 | 23.57 | 231.39 | 0.4846 | -1011.0 | -811.6 | |
| 0 | 3 | 0 | 2 | -19.77 | 120.42 | 23.54 | 230.72 | 0.4875 | -817.0 | -752.8 | |
| 0 | 5 | 0 | 3 | -18.95 | 120.25 | 23.37 | 231.95 | 0.4783 | -938.0 | -906.4 | |
| 3 | 14 | 1 | 8 | -19.12 | 119.96 | 23.07 | 231.33 | 0.4762 | -1195.0 | -882.8 | |
| 3 | -13 | 1 | -13 | -19.04 | 119.59 | 22.70 | 231.04 | 0.4711 | -1085.4 | 999999 | |
| 3 | 25 | 2 | 14 | -20.03 | 119.60 | 22.71 | 229.35 | 0.4801 | -1001.1 | -878.0 | |
| 8 | -15 | 4 | -15 | -20.00 | 119.32 | 22.44 | 229.09 | 0.4765 | -1319.3 | 999999 | |
| 0 | 10 | 0 | 5 | -20.50 | 118.85 | 21.97 | 227.69 | 0.4758 | -911.0 | -627.8 | |
| 0 | 6 | 0 | 3 | -19.22 | 118.62 | 21.74 | 229.59 | 0.4612 | 374.0 | 441.9 | |
| 2 | 16 | 1 | 9 | -19.80 | 118.21 | 21.33 | 228.07 | 0.4618 | 661.0 | 721.1 | |
| 1 | -19 | 1 | -19 | -19.47 | 118.03 | 21.14 | 228.41 | 0.4566 | 991.6 | 999999 | |
| 0 | 4 | 0 | 2 | -20.68 | 117.57 | 20.69 | 225.77 | 0.4631 | -963.0 | -752.1 | |
| 0 | 9 | 0 | 5 | -21.10 | 117.05 | 20.16 | 224.38 | 0.4617 | -46.0 | 74.2 | |
| 0 | 4 | 0 | 2 | -21.77 | 116.74 | 19.85 | 222.88 | 0.4654 | 235.0 | 275.5 | |
| 0 | 19 | 0 | 11 | -21.15 | 116.38 | 19.50 | 223.39 | 0.4550 | 872.0 | 649.8 | |
| 0 | 15 | 0 | 8 | -22.16 | 116.12 | 19.23 | 221.42 | 0.4630 | 687.0 | 677.9 | |
| 0 | 3 | 0 | 2 | -21.04 | 115.61 | 18.72 | 222.48 | 0.4455 | 817.0 | 631.9 | |
| 0 | 3 | 0 | 2 | -20.62 | 115.42 | 18.54 | 222.88 | 0.4390 | 887.0 | 824.8 | |
| 0 | 5 | 0 | 3 | -22.37 | 115.65 | 18.77 | 220.43 | 0.4607 | 779.0 | 550.7 | |
| 9 | 310 | 5 | 171 | -21.67 | 114.93 | 18.05 | 220.47 | 0.4455 | 1343.5 | 804.1 | |
| 0 | 3 | 0 | 1 | -20.84 | 114.83 | 17.94 | 221.64 | 0.4351 | 1008.0 | 856.1 | |
| 1 | -29 | 1 | -29 | -21.38 | 114.85 | 17.97 | 220.81 | 0.4414 | 1653.9 | 999999 | |
| 3 | -29 | 2 | -29 | -21.51 | 114.56 | 17.67 | 220.15 | 0.4398 | 1720.3 | 999999 | |
| 20 | -29 | 11 | -29 | -22.05 | 114.31 | 17.43 | 218.93 | 0.4437 | 1752.5 | 999999 | |
| 10 | -29 | 6 | -29 | -21.64 | 114.00 | 17.11 | 219.08 | 0.4357 | 2159.3 | 999999 | |
| 0 | 4 | 0 | 2 | -23.74 | 114.18 | 17.30 | 216.25 | 0.4621 | 774.0 | 520.7 | |
| 4 | -29 | 2 | -29 | -22.02 | 113.82 | 16.94 | 218.22 | 0.4384 | 1654.7 | 999999 | |
| Proj. U | - Projected umbra area in millionths of solar disc, negative values indicate | |
|
that the umbra consists of fragmented regions which cannot be separated without losing umbral area. In this way several spots (intensity minima in the umbra) have a common umbra, e.g. -2 means that the given spot shares an umbra with spot No.2, and the common U value is indicated at spot No.2. |
||
| Proj. WS | - Projected whole spot area in millionths of solar disc, negative values indicate | |
|
that several umbras have a common penumbra, e.g. -7 means that the given umbra shares a penumbra with umbra No.7, and the WS value is indicated at No.7. |
||
| Corr. U | - Corrected umbra area in millionths of solar hemisphere, for negative values see above | |
| Corr. WS | - Corrected whole spot area in millionths of solar hemisphere, for negative values see above | |
| B | - Heliographic latitude B; positive: North, negative: South | |
| L | - Heliographic longitude L | |
| LCM | - Longitudinal distance from the Sun's central meridian | |
| Pos. angle | - Position angle | |
| r | - Distance from the centre of Sun's disc in terms of Sun's radius | |
| MU | - Mean magnetic field within the umbra contour averaged the pixel values with sign. | |
| MP | - Mean magnetic field within the penumbra contour averaged the pixel values with sign. | |