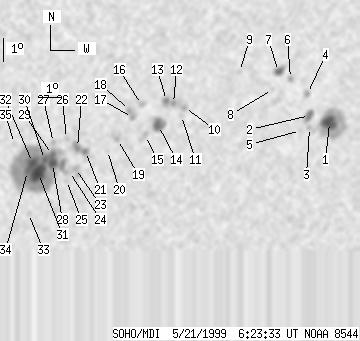
SOHO MDI 1999-05-21 06:23:33 UT
| group | Proj. U | Proj. WS | Corr. U | Corr. WS | B | L | LCM | Pos. angle | r | MU | MP |
| 109 | 596 | 64 | 340 | -20.88 | 118.63 | 22.63 | 226.96 | 0.4906 | 162.6 | 292.6 | |
|
previous
or next observation for the same group /
back to the solar disc SOHO MDI 1999-05-21 06:23:33 UT |
| spot | Proj. U | Proj. WS | Corr. U | Corr. WS | B | L | LCM | Pos. angle | r | MU | MP |
| 18 | 100 | 11 | 61 | -19.81 | 127.48 | 31.47 | 237.73 | 0.5832 | -1410.3 | -434.7 | |
| 7 | 16 | 4 | 10 | -19.54 | 126.44 | 30.44 | 237.40 | 0.5689 | -1287.9 | -860.4 | |
| 0 | 7 | 0 | 4 | -20.03 | 126.55 | 30.55 | 236.70 | 0.5734 | -867.0 | -700.4 | |
| 0 | 7 | 0 | 4 | -18.64 | 126.16 | 30.16 | 238.63 | 0.5597 | -1088.0 | -829.2 | |
| 0 | 4 | 0 | 3 | -20.16 | 126.14 | 30.14 | 236.19 | 0.5694 | -738.0 | -594.8 | |
| 0 | 5 | 0 | 3 | -18.04 | 125.24 | 29.23 | 238.92 | 0.5444 | -757.0 | -471.0 | |
| 6 | 13 | 4 | 7 | -17.76 | 124.62 | 28.62 | 238.90 | 0.5348 | -1067.0 | -822.3 | |
| 0 | 3 | 0 | 2 | -18.50 | 124.47 | 28.47 | 237.54 | 0.5378 | 324.0 | 275.7 | |
| 0 | 2 | 0 | 1 | -17.79 | 122.80 | 26.80 | 237.35 | 0.5120 | -100.0 | -132.5 | |
| 0 | 4 | 0 | 2 | -19.30 | 120.52 | 24.51 | 232.56 | 0.4952 | -825.0 | -795.1 | |
| 0 | 3 | 0 | 2 | -19.63 | 120.43 | 24.43 | 231.91 | 0.4969 | -701.0 | -474.7 | |
| 4 | 15 | 2 | 9 | -19.14 | 119.99 | 23.98 | 232.28 | 0.4875 | -1086.2 | -906.5 | |
| 3 | -12 | 2 | -12 | -19.02 | 119.65 | 23.65 | 232.12 | 0.4824 | -1215.4 | 999999 | |
| 12 | 25 | 7 | 14 | -20.06 | 119.45 | 23.44 | 230.13 | 0.4889 | -1283.3 | -816.9 | |
| 0 | 10 | 0 | 6 | -20.48 | 118.92 | 22.92 | 228.83 | 0.4866 | -518.0 | -572.5 | |
| 0 | 4 | 0 | 2 | -19.20 | 118.55 | 22.54 | 230.57 | 0.4707 | 484.0 | 579.2 | |
| 2 | 12 | 1 | 7 | -19.74 | 118.22 | 22.21 | 229.25 | 0.4717 | 659.4 | 798.5 | |
| 1 | -17 | 1 | -17 | -19.46 | 118.04 | 22.04 | 229.53 | 0.4670 | 1022.0 | 999999 | |
| 0 | 6 | 0 | 4 | -20.66 | 117.68 | 21.67 | 227.04 | 0.4741 | -956.0 | -872.7 | |
| 0 | 3 | 0 | 1 | -21.12 | 117.29 | 21.29 | 225.81 | 0.4743 | 447.0 | 294.4 | |
| 3 | 21 | 2 | 12 | -21.18 | 116.31 | 20.31 | 224.44 | 0.4641 | 390.8 | 673.7 | |
| 3 | -21 | 2 | -21 | -21.02 | 115.93 | 19.92 | 224.19 | 0.4583 | 1052.4 | 999999 | |
| 0 | 12 | 0 | 7 | -21.89 | 115.96 | 19.96 | 222.83 | 0.4678 | 890.0 | 614.6 | |
| 0 | 10 | 0 | 5 | -22.02 | 115.71 | 19.71 | 222.29 | 0.4665 | 770.0 | 781.7 | |
| 0 | 3 | 0 | 1 | -22.40 | 115.63 | 19.63 | 221.59 | 0.4698 | 678.0 | 614.2 | |
| 0 | 3 | 0 | 2 | -20.65 | 115.38 | 19.38 | 224.05 | 0.4485 | 864.0 | 929.1 | |
| 0 | 4 | 0 | 2 | -20.82 | 114.83 | 18.83 | 222.97 | 0.4444 | 1095.0 | 818.0 | |
| 8 | 297 | 5 | 165 | -21.69 | 114.90 | 18.90 | 221.66 | 0.4546 | 1376.8 | 818.8 | |
| 5 | -28 | 3 | -28 | -21.32 | 114.85 | 18.85 | 222.19 | 0.4500 | 1398.3 | 999999 | |
| 2 | -28 | 1 | -28 | -21.53 | 114.52 | 18.52 | 221.37 | 0.4489 | 1776.5 | 999999 | |
| 20 | -28 | 11 | -28 | -22.12 | 114.33 | 18.33 | 220.17 | 0.4535 | 1724.3 | 999999 | |
| 9 | -28 | 5 | -28 | -21.66 | 114.00 | 18.00 | 220.40 | 0.4450 | 2127.8 | 999999 | |
| 0 | 4 | 0 | 2 | -23.81 | 114.12 | 18.12 | 217.37 | 0.4707 | 673.0 | 462.0 | |
| 6 | -28 | 3 | -28 | -22.04 | 113.83 | 17.83 | 219.55 | 0.4476 | 1600.7 | 999999 | |
| 0 | 3 | 0 | 2 | -20.88 | 113.11 | 17.11 | 220.27 | 0.4270 | 505.0 | 438.7 | |
| Proj. U | - Projected umbra area in millionths of solar disc, negative values indicate | |
|
that the umbra consists of fragmented regions which cannot be separated without losing umbral area. In this way several spots (intensity minima in the umbra) have a common umbra, e.g. -2 means that the given spot shares an umbra with spot No.2, and the common U value is indicated at spot No.2. |
||
| Proj. WS | - Projected whole spot area in millionths of solar disc, negative values indicate | |
|
that several umbras have a common penumbra, e.g. -7 means that the given umbra shares a penumbra with umbra No.7, and the WS value is indicated at No.7. |
||
| Corr. U | - Corrected umbra area in millionths of solar hemisphere, for negative values see above | |
| Corr. WS | - Corrected whole spot area in millionths of solar hemisphere, for negative values see above | |
| B | - Heliographic latitude B; positive: North, negative: South | |
| L | - Heliographic longitude L | |
| LCM | - Longitudinal distance from the Sun's central meridian | |
| Pos. angle | - Position angle | |
| r | - Distance from the centre of Sun's disc in terms of Sun's radius | |
| MU | - Mean magnetic field within the umbra contour averaged the pixel values with sign. | |
| MP | - Mean magnetic field within the penumbra contour averaged the pixel values with sign. | |