SOHO MDI 1999-05-21 07:59:33 UT
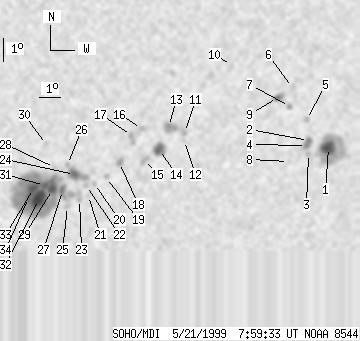
| group | Proj. U | Proj. WS | Corr. U | Corr. WS | B | L | LCM | Pos. angle | r | MU | MP |
| 109 | 613 | 61 | 351 | -20.85 | 118.64 | 23.52 | 228.06 | 0.5003 | 286.8 | 259.0 | |
|
previous
or next observation for the same group /
back to the solar disc SOHO MDI 1999-05-21 07:59:33 UT |
| spot | Proj. U | Proj. WS | Corr. U | Corr. WS | B | L | LCM | Pos. angle | r | MU | MP |
| 19 | 107 | 12 | 66 | -19.79 | 127.48 | 32.36 | 238.37 | 0.5937 | -1437.5 | -369.3 | |
| 2 | 14 | 1 | 9 | -19.52 | 126.44 | 31.31 | 238.06 | 0.5795 | -1343.5 | -930.5 | |
| 0 | 3 | 0 | 2 | -20.05 | 126.55 | 31.43 | 237.32 | 0.5842 | -792.0 | -762.3 | |
| 3 | -2 | 2 | -2 | -19.72 | 126.38 | 31.26 | 237.70 | 0.5801 | -1232.1 | 999999 | |
| 0 | 4 | 0 | 2 | -18.65 | 126.16 | 31.04 | 239.22 | 0.5708 | -1138.0 | -880.0 | |
| 0 | 5 | 0 | 3 | -17.36 | 125.23 | 30.11 | 240.68 | 0.5514 | -855.0 | -719.3 | |
| 0 | 6 | 0 | 4 | -18.14 | 125.24 | 30.11 | 239.40 | 0.5561 | -836.0 | -477.8 | |
| 0 | 3 | 0 | 2 | -20.40 | 125.65 | 30.53 | 236.11 | 0.5758 | -610.0 | -623.9 | |
| 5 | 12 | 3 | 7 | -17.78 | 124.60 | 29.47 | 239.52 | 0.5458 | -1105.9 | -791.6 | |
| 0 | 6 | 0 | 4 | -16.51 | 122.23 | 27.11 | 239.85 | 0.5073 | -690.0 | -618.9 | |
| 0 | 5 | 0 | 3 | -19.28 | 120.51 | 25.39 | 233.46 | 0.5057 | -961.0 | -818.8 | |
| 0 | 2 | 0 | 1 | -19.61 | 120.56 | 25.44 | 232.97 | 0.5090 | -594.0 | -577.0 | |
| 3 | 19 | 1 | 11 | -19.04 | 119.73 | 24.61 | 233.09 | 0.4943 | -1290.5 | -967.4 | |
| 11 | 22 | 6 | 13 | -20.00 | 119.47 | 24.35 | 231.21 | 0.4992 | -1297.3 | -822.6 | |
| 0 | 8 | 0 | 5 | -20.42 | 118.86 | 23.73 | 229.84 | 0.4956 | -513.0 | -574.5 | |
| 0 | 7 | 0 | 4 | -19.14 | 118.52 | 23.40 | 231.62 | 0.4804 | 783.0 | 550.0 | |
| 0 | 10 | 0 | 5 | -19.44 | 118.11 | 22.99 | 230.66 | 0.4781 | 1078.0 | 800.9 | |
| 0 | 7 | 0 | 4 | -20.56 | 117.74 | 22.61 | 228.33 | 0.4839 | -918.0 | -834.8 | |
| 0 | 4 | 0 | 2 | -21.19 | 117.24 | 22.12 | 226.71 | 0.4843 | 304.0 | 182.5 | |
| 0 | 4 | 0 | 2 | -21.45 | 116.74 | 21.61 | 225.68 | 0.4812 | 511.0 | 530.9 | |
| 0 | 3 | 0 | 1 | -21.95 | 116.54 | 21.42 | 224.64 | 0.4841 | 291.0 | 300.0 | |
| 0 | 4 | 0 | 2 | -21.53 | 116.39 | 21.26 | 225.10 | 0.4782 | 990.0 | 796.2 | |
| 0 | 10 | 0 | 5 | -22.12 | 116.16 | 21.04 | 223.88 | 0.4817 | 723.0 | 560.6 | |
| 9 | 29 | 5 | 16 | -21.08 | 115.78 | 20.65 | 225.04 | 0.4670 | 1184.8 | 510.5 | |
| 0 | 4 | 0 | 2 | -22.42 | 115.66 | 20.54 | 222.77 | 0.4795 | 783.0 | 606.1 | |
| 0 | 4 | 0 | 2 | -20.67 | 115.40 | 20.28 | 225.23 | 0.4587 | 1052.0 | 948.5 | |
| 4 | 305 | 2 | 170 | -21.76 | 115.33 | 20.21 | 223.38 | 0.4691 | 1082.0 | 806.4 | |
| 0 | 3 | 0 | 2 | -20.80 | 114.84 | 19.72 | 224.25 | 0.4539 | 951.0 | 786.2 | |
| 7 | -27 | 4 | -27 | -21.72 | 114.88 | 19.76 | 222.82 | 0.4639 | 1414.4 | 999999 | |
| 0 | 3 | 0 | 2 | -19.85 | 114.36 | 19.24 | 225.17 | 0.4387 | 962.0 | 848.8 | |
| 4 | -27 | 2 | -27 | -21.56 | 114.50 | 19.37 | 222.55 | 0.4582 | 1814.8 | 999999 | |
| 28 | -27 | 16 | -27 | -22.14 | 114.31 | 19.19 | 221.36 | 0.4626 | 1626.2 | 999999 | |
| 8 | -27 | 4 | -27 | -21.69 | 114.02 | 18.90 | 221.67 | 0.4546 | 2103.6 | 999999 | |
| 6 | -27 | 3 | -27 | -22.07 | 113.85 | 18.73 | 220.83 | 0.4570 | 1545.6 | 999999 | |
| Proj. U | - Projected umbra area in millionths of solar disc, negative values indicate | |
|
that the umbra consists of fragmented regions which cannot be separated without losing umbral area. In this way several spots (intensity minima in the umbra) have a common umbra, e.g. -2 means that the given spot shares an umbra with spot No.2, and the common U value is indicated at spot No.2. |
||
| Proj. WS | - Projected whole spot area in millionths of solar disc, negative values indicate | |
|
that several umbras have a common penumbra, e.g. -7 means that the given umbra shares a penumbra with umbra No.7, and the WS value is indicated at No.7. |
||
| Corr. U | - Corrected umbra area in millionths of solar hemisphere, for negative values see above | |
| Corr. WS | - Corrected whole spot area in millionths of solar hemisphere, for negative values see above | |
| B | - Heliographic latitude B; positive: North, negative: South | |
| L | - Heliographic longitude L | |
| LCM | - Longitudinal distance from the Sun's central meridian | |
| Pos. angle | - Position angle | |
| r | - Distance from the centre of Sun's disc in terms of Sun's radius | |
| MU | - Mean magnetic field within the umbra contour averaged the pixel values with sign. | |
| MP | - Mean magnetic field within the penumbra contour averaged the pixel values with sign. | |