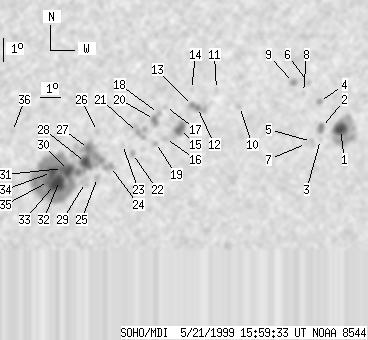
SOHO MDI 1999-05-21 15:59:33 UT
| group | Proj. U | Proj. WS | Corr. U | Corr. WS | B | L | LCM | Pos. angle | r | MU | MP |
| 97 | 655 | 58 | 385 | -20.94 | 117.98 | 27.27 | 231.90 | 0.5432 | 383.0 | 299.5 | |
|
previous
or next observation for the same group /
back to the solar disc SOHO MDI 1999-05-21 15:59:33 UT |
| spot | Proj. U | Proj. WS | Corr. U | Corr. WS | B | L | LCM | Pos. angle | r | MU | MP |
| 14 | 83 | 9 | 54 | -19.79 | 127.56 | 36.84 | 241.03 | 0.6472 | -1355.5 | -380.7 | |
| 4 | 11 | 3 | 7 | -19.73 | 126.55 | 35.84 | 240.57 | 0.6351 | -1014.2 | -783.6 | |
| 0 | 3 | 0 | 2 | -20.23 | 126.63 | 35.92 | 239.89 | 0.6386 | -496.0 | -571.7 | |
| 0 | 5 | 0 | 3 | -18.67 | 126.18 | 35.47 | 241.94 | 0.6252 | -560.0 | -534.8 | |
| 0 | 5 | 0 | 3 | -20.32 | 126.19 | 35.48 | 239.50 | 0.6339 | -867.0 | -672.3 | |
| 0 | 3 | 0 | 2 | -17.90 | 125.45 | 34.73 | 242.68 | 0.6124 | -709.0 | -709.2 | |
| 0 | 3 | 0 | 2 | -20.41 | 125.96 | 35.24 | 239.24 | 0.6316 | -766.0 | -667.4 | |
| 0 | 3 | 0 | 2 | -18.31 | 125.29 | 34.57 | 241.96 | 0.6126 | -674.0 | -547.4 | |
| 0 | 8 | 0 | 5 | -17.91 | 124.70 | 33.98 | 242.23 | 0.6033 | -996.0 | -779.9 | |
| 0 | 6 | 0 | 3 | -18.94 | 122.25 | 31.54 | 239.07 | 0.5789 | 580.0 | 210.7 | |
| 0 | 4 | 0 | 2 | -18.26 | 121.00 | 30.28 | 239.26 | 0.5593 | -555.0 | -517.9 | |
| 2 | 20 | 1 | 12 | -19.02 | 120.23 | 29.52 | 237.47 | 0.5547 | -1249.8 | -932.8 | |
| 2 | -12 | 1 | -12 | -18.94 | 119.98 | 29.27 | 237.40 | 0.5510 | -1176.6 | 999999 | |
| 0 | 2 | 0 | 1 | -18.28 | 119.81 | 29.09 | 238.34 | 0.5446 | -553.0 | -464.5 | |
| 11 | 22 | 6 | 13 | -19.94 | 119.56 | 28.84 | 235.45 | 0.5527 | -1229.4 | -840.6 | |
| 0 | 4 | 0 | 3 | -20.32 | 118.96 | 28.25 | 234.35 | 0.5484 | -575.0 | -614.2 | |
| 0 | 4 | 0 | 2 | -19.00 | 118.71 | 28.00 | 236.26 | 0.5358 | 369.0 | 285.7 | |
| 0 | 6 | 0 | 4 | -19.29 | 118.44 | 27.72 | 235.55 | 0.5345 | 993.0 | 854.2 | |
| 0 | 4 | 0 | 2 | -20.49 | 118.52 | 27.81 | 233.69 | 0.5444 | -902.0 | -861.4 | |
| 3 | 10 | 2 | 6 | -19.54 | 118.29 | 27.58 | 235.01 | 0.5346 | 931.4 | 628.8 | |
| 0 | 25 | 0 | 15 | -20.09 | 117.59 | 26.88 | 233.49 | 0.5303 | -1202.0 | -774.6 | |
| 0 | 4 | 0 | 2 | -20.97 | 117.53 | 26.81 | 232.03 | 0.5364 | 633.0 | 501.2 | |
| 0 | 2 | 0 | 1 | -20.60 | 116.99 | 26.27 | 232.10 | 0.5271 | -277.0 | -500.2 | |
| 0 | 13 | 0 | 7 | -21.52 | 116.60 | 25.88 | 230.26 | 0.5302 | 652.0 | 466.2 | |
| 0 | 5 | 0 | 3 | -21.99 | 116.07 | 25.36 | 229.01 | 0.5283 | 635.0 | 580.9 | |
| 0 | 5 | 0 | 3 | -20.08 | 115.73 | 25.01 | 231.71 | 0.5080 | 811.0 | 626.8 | |
| 5 | 382 | 3 | 219 | -20.79 | 115.43 | 24.72 | 230.24 | 0.5106 | 922.2 | 785.0 | |
| 11 | -27 | 7 | -27 | -21.37 | 115.40 | 24.68 | 229.27 | 0.5152 | 1463.8 | 999999 | |
| 0 | 11 | 0 | 6 | -22.21 | 115.55 | 24.84 | 228.13 | 0.5243 | 658.0 | 559.0 | |
| 8 | -27 | 5 | -27 | -21.72 | 114.67 | 23.96 | 227.94 | 0.5101 | 1489.9 | 999999 | |
| 3 | -27 | 2 | -27 | -21.64 | 114.38 | 23.66 | 227.74 | 0.5061 | 1826.0 | 999999 | |
| 23 | -27 | 13 | -27 | -22.14 | 114.33 | 23.61 | 226.90 | 0.5102 | 1609.6 | 999999 | |
| -32 | -27 | -32 | -27 | -22.31 | 114.13 | 23.41 | 226.41 | 0.5096 | 999999 | 999999 | |
| 9 | -27 | 5 | -27 | -21.81 | 113.90 | 23.19 | 226.93 | 0.5024 | 2075.0 | 999999 | |
| 2 | -27 | 1 | -27 | -22.19 | 113.83 | 23.11 | 226.26 | 0.5052 | 1664.7 | 999999 | |
| 0 | 2 | 0 | 1 | -20.13 | 111.86 | 21.15 | 227.21 | 0.4635 | 545.0 | 467.0 | |
| Proj. U | - Projected umbra area in millionths of solar disc, negative values indicate | |
|
that the umbra consists of fragmented regions which cannot be separated without losing umbral area. In this way several spots (intensity minima in the umbra) have a common umbra, e.g. -2 means that the given spot shares an umbra with spot No.2, and the common U value is indicated at spot No.2. |
||
| Proj. WS | - Projected whole spot area in millionths of solar disc, negative values indicate | |
|
that several umbras have a common penumbra, e.g. -7 means that the given umbra shares a penumbra with umbra No.7, and the WS value is indicated at No.7. |
||
| Corr. U | - Corrected umbra area in millionths of solar hemisphere, for negative values see above | |
| Corr. WS | - Corrected whole spot area in millionths of solar hemisphere, for negative values see above | |
| B | - Heliographic latitude B; positive: North, negative: South | |
| L | - Heliographic longitude L | |
| LCM | - Longitudinal distance from the Sun's central meridian | |
| Pos. angle | - Position angle | |
| r | - Distance from the centre of Sun's disc in terms of Sun's radius | |
| MU | - Mean magnetic field within the umbra contour averaged the pixel values with sign. | |
| MP | - Mean magnetic field within the penumbra contour averaged the pixel values with sign. | |