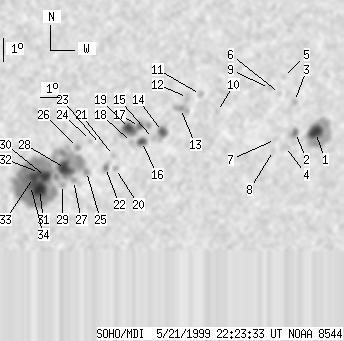
SOHO MDI 1999-05-21 22:23:33 UT
| group | Proj. U | Proj. WS | Corr. U | Corr. WS | B | L | LCM | Pos. angle | r | MU | MP |
| 111 | 690 | 68 | 427 | -21.07 | 117.98 | 30.79 | 234.70 | 0.5849 | 292.7 | 300.1 | |
|
previous
or next observation for the same group /
back to the solar disc SOHO MDI 1999-05-21 22:23:33 UT |
| spot | Proj. U | Proj. WS | Corr. U | Corr. WS | B | L | LCM | Pos. angle | r | MU | MP |
| 16 | 85 | 11 | 58 | -19.78 | 127.63 | 40.44 | 242.79 | 0.6886 | -1204.3 | -252.5 | |
| 4 | 11 | 3 | 8 | -19.80 | 126.54 | 39.35 | 242.26 | 0.6764 | -911.8 | -555.2 | |
| 0 | 5 | 0 | 3 | -18.53 | 126.13 | 38.94 | 243.86 | 0.6661 | -799.0 | -472.4 | |
| 0 | 10 | 0 | 7 | -20.39 | 126.18 | 38.99 | 241.26 | 0.6749 | -675.0 | -590.6 | |
| 0 | 3 | 0 | 2 | -17.52 | 125.28 | 38.09 | 244.92 | 0.6518 | -446.0 | -430.3 | |
| 0 | 3 | 0 | 2 | -18.22 | 125.25 | 38.06 | 243.89 | 0.6544 | -781.0 | -563.0 | |
| 0 | 4 | 0 | 3 | -20.11 | 125.56 | 38.37 | 241.34 | 0.6665 | -735.0 | -697.6 | |
| 0 | 5 | 0 | 4 | -20.57 | 125.58 | 38.39 | 240.71 | 0.6690 | -781.0 | -587.8 | |
| 0 | 3 | 0 | 2 | -18.03 | 124.67 | 37.48 | 243.90 | 0.6467 | -499.0 | -765.7 | |
| 0 | 2 | 0 | 2 | -19.02 | 122.24 | 35.05 | 241.13 | 0.6222 | 385.0 | 291.0 | |
| 0 | 5 | 0 | 3 | -18.34 | 121.22 | 34.03 | 241.57 | 0.6063 | -734.0 | -561.8 | |
| 0 | 6 | 0 | 4 | -18.47 | 120.60 | 33.41 | 240.99 | 0.5994 | -873.0 | -757.4 | |
| 0 | 13 | 0 | 8 | -18.93 | 120.35 | 33.16 | 240.13 | 0.5990 | -1016.0 | -869.7 | |
| 7 | 19 | 4 | 12 | -19.89 | 119.68 | 32.49 | 238.21 | 0.5964 | -1124.7 | -777.5 | |
| 0 | 3 | 0 | 2 | -20.19 | 119.30 | 32.11 | 237.50 | 0.5937 | -741.0 | -680.2 | |
| 6 | 13 | 4 | 8 | -20.32 | 118.74 | 31.55 | 236.90 | 0.5879 | -1055.9 | -734.8 | |
| 4 | 49 | 2 | 30 | -19.71 | 118.50 | 31.31 | 237.68 | 0.5812 | 769.5 | -324.0 | |
| 0 | 3 | 0 | 2 | -20.37 | 118.26 | 31.07 | 236.47 | 0.5825 | -358.0 | -498.2 | |
| 10 | -17 | 6 | -17 | -19.80 | 118.03 | 30.84 | 237.20 | 0.5761 | -1144.1 | 999999 | |
| 0 | 4 | 0 | 2 | -21.47 | 117.72 | 30.53 | 234.41 | 0.5836 | 700.0 | 609.0 | |
| 0 | 4 | 0 | 3 | -20.93 | 117.50 | 30.31 | 235.05 | 0.5773 | 616.0 | 402.0 | |
| 3 | 8 | 2 | 5 | -21.43 | 117.22 | 30.04 | 234.07 | 0.5776 | 762.9 | 450.2 | |
| 0 | 3 | 0 | 2 | -20.48 | 116.77 | 29.58 | 235.16 | 0.5656 | -405.0 | -484.3 | |
| 0 | 4 | 0 | 2 | -20.32 | 116.26 | 29.07 | 234.99 | 0.5584 | 366.0 | 238.4 | |
| 0 | 7 | 0 | 4 | -21.61 | 116.34 | 29.15 | 233.07 | 0.5687 | 780.0 | 642.3 | |
| 0 | 4 | 0 | 3 | -20.62 | 115.70 | 28.51 | 234.05 | 0.5539 | 1060.0 | 759.4 | |
| 0 | 5 | 0 | 3 | -22.00 | 115.80 | 28.61 | 232.02 | 0.5654 | 609.0 | 550.9 | |
| 16 | 405 | 9 | 240 | -21.51 | 115.30 | 28.11 | 232.34 | 0.5560 | 1380.5 | 750.9 | |
| 0 | 4 | 0 | 3 | -22.18 | 115.30 | 28.11 | 231.32 | 0.5611 | 457.0 | 414.5 | |
| 9 | -28 | 6 | -28 | -21.85 | 114.42 | 27.23 | 231.00 | 0.5486 | 1589.9 | 999999 | |
| 19 | -28 | 11 | -28 | -22.40 | 114.25 | 27.06 | 230.01 | 0.5511 | 1541.0 | 999999 | |
| 4 | -28 | 2 | -28 | -21.69 | 114.10 | 26.91 | 230.96 | 0.5436 | 1883.2 | 999999 | |
| 8 | -28 | 5 | -28 | -21.90 | 113.86 | 26.67 | 230.40 | 0.5426 | 2081.1 | 999999 | |
| 5 | -28 | 3 | -28 | -22.24 | 113.78 | 26.60 | 229.81 | 0.5445 | 1779.0 | 999999 | |
| Proj. U | - Projected umbra area in millionths of solar disc, negative values indicate | |
|
that the umbra consists of fragmented regions which cannot be separated without losing umbral area. In this way several spots (intensity minima in the umbra) have a common umbra, e.g. -2 means that the given spot shares an umbra with spot No.2, and the common U value is indicated at spot No.2. |
||
| Proj. WS | - Projected whole spot area in millionths of solar disc, negative values indicate | |
|
that several umbras have a common penumbra, e.g. -7 means that the given umbra shares a penumbra with umbra No.7, and the WS value is indicated at No.7. |
||
| Corr. U | - Corrected umbra area in millionths of solar hemisphere, for negative values see above | |
| Corr. WS | - Corrected whole spot area in millionths of solar hemisphere, for negative values see above | |
| B | - Heliographic latitude B; positive: North, negative: South | |
| L | - Heliographic longitude L | |
| LCM | - Longitudinal distance from the Sun's central meridian | |
| Pos. angle | - Position angle | |
| r | - Distance from the centre of Sun's disc in terms of Sun's radius | |
| MU | - Mean magnetic field within the umbra contour averaged the pixel values with sign. | |
| MP | - Mean magnetic field within the penumbra contour averaged the pixel values with sign. | |