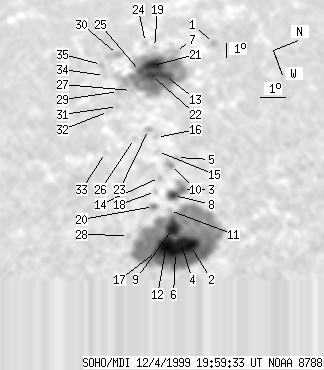
SOHO MDI 1999-12-04 19:59:33 UT
| group | Proj. U | Proj. WS | Corr. U | Corr. WS | B | L | LCM | Pos. angle | r | MU | MP |
| 133 | 1039 | 122 | 972 | 10.25 | 308.73 | -57.37 | 78.05 | 0.8438 | 437.7 | 61.6 | |
|
previous
or next observation for the same group /
back to the solar disc SOHO MDI 1999-12-04 19:59:33 UT |
| spot | Proj. U | Proj. WS | Corr. U | Corr. WS | B | L | LCM | Pos. angle | r | MU | MP |
| 0 | 7 | 0 | 9 | 13.70 | 300.13 | -65.97 | 75.22 | 0.9195 | -133.0 | -96.5 | |
| 17 | 598 | 14 | 481 | 10.11 | 315.05 | -51.06 | 77.38 | 0.7870 | 1390.0 | 408.8 | |
| 3 | 35 | 3 | 30 | 10.58 | 311.35 | -54.75 | 77.38 | 0.8249 | 253.0 | 254.0 | |
| 11 | -2 | 9 | -2 | 9.80 | 314.66 | -51.44 | 77.84 | 0.7906 | 945.7 | 999999 | |
| 0 | 5 | 0 | 4 | 10.79 | 309.05 | -57.05 | 77.44 | 0.8467 | -204.0 | -168.4 | |
| 16 | -2 | 13 | -2 | 9.47 | 315.26 | -50.85 | 78.16 | 0.7838 | 1873.6 | 999999 | |
| 0 | 8 | 0 | 10 | 12.19 | 300.32 | -65.78 | 76.84 | 0.9172 | 75.0 | 74.7 | |
| 9 | -3 | 7 | -3 | 10.17 | 311.62 | -54.48 | 77.83 | 0.8218 | 594.6 | 999999 | |
| 14 | -2 | 12 | -2 | 9.69 | 313.73 | -52.37 | 78.12 | 0.8000 | 720.5 | 999999 | |
| 0 | 8 | 0 | 7 | 10.47 | 309.52 | -56.58 | 77.76 | 0.8420 | -483.0 | -254.3 | |
| 0 | 3 | 0 | 2 | 9.82 | 312.54 | -53.56 | 78.13 | 0.8123 | 246.0 | 227.4 | |
| 23 | -2 | 18 | -2 | 9.25 | 314.64 | -51.46 | 78.53 | 0.7901 | 1122.5 | 999999 | |
| 9 | 290 | 10 | 337 | 11.46 | 302.37 | -63.74 | 77.44 | 0.9023 | -704.3 | -422.9 | |
| 0 | 4 | 0 | 3 | 9.90 | 310.19 | -55.91 | 78.35 | 0.8352 | 51.0 | 85.3 | |
| 0 | 3 | 0 | 2 | 10.18 | 308.32 | -57.78 | 78.25 | 0.8526 | 93.0 | 102.2 | |
| 0 | 3 | 0 | 3 | 10.33 | 307.28 | -58.82 | 78.19 | 0.8620 | 154.0 | 133.6 | |
| 2 | -2 | 2 | -2 | 8.79 | 314.91 | -51.19 | 79.07 | 0.7866 | 1233.5 | 999999 | |
| 0 | 3 | 0 | 3 | 9.57 | 311.08 | -55.02 | 78.63 | 0.8264 | 362.0 | 331.9 | |
| 0 | 3 | 0 | 4 | 11.47 | 299.57 | -66.53 | 77.68 | 0.9218 | 86.0 | 176.8 | |
| 1 | 8 | 1 | 7 | 9.29 | 312.04 | -54.06 | 78.84 | 0.8167 | 581.0 | 445.9 | |
| 16 | -13 | 19 | -13 | 11.16 | 301.26 | -64.85 | 77.88 | 0.9101 | -332.8 | 999999 | |
| 7 | -13 | 9 | -13 | 10.99 | 302.15 | -63.96 | 77.99 | 0.9036 | -981.6 | 999999 | |
| 0 | 6 | 0 | 6 | 10.15 | 306.54 | -59.56 | 78.49 | 0.8682 | 168.0 | 107.1 | |
| 0 | 3 | 0 | 4 | 11.21 | 298.90 | -67.20 | 78.02 | 0.9261 | 206.0 | 256.6 | |
| 5 | -13 | 5 | -13 | 10.64 | 301.59 | -64.51 | 78.42 | 0.9074 | -586.4 | 999999 | |
| 0 | 3 | 0 | 3 | 9.52 | 306.99 | -59.11 | 79.17 | 0.8638 | 142.0 | 151.2 | |
| 0 | 2 | 0 | 2 | 10.06 | 303.10 | -63.00 | 78.93 | 0.8958 | -761.0 | -745.4 | |
| 0 | 3 | 0 | 3 | 7.99 | 313.49 | -52.61 | 80.26 | 0.8006 | -184.0 | -141.4 | |
| 0 | 8 | 0 | 9 | 9.57 | 302.95 | -63.15 | 79.49 | 0.8967 | -238.0 | -298.3 | |
| 0 | 19 | 0 | 23 | 10.03 | 299.55 | -66.55 | 79.25 | 0.9212 | 391.0 | 254.1 | |
| 0 | 4 | 0 | 5 | 9.33 | 304.19 | -61.91 | 79.65 | 0.8869 | -211.0 | -246.7 | |
| 0 | 3 | 0 | 4 | 8.94 | 304.43 | -61.67 | 80.07 | 0.8848 | -313.0 | -220.9 | |
| 0 | 1 | 0 | 1 | 8.28 | 307.52 | -58.58 | 80.55 | 0.8582 | -117.0 | -91.5 | |
| 0 | 3 | 0 | 3 | 9.27 | 301.27 | -64.83 | 79.95 | 0.9090 | -275.0 | -276.8 | |
| 0 | 6 | 0 | 7 | 9.31 | 300.19 | -65.91 | 79.99 | 0.9166 | -44.0 | -77.5 | |
| Proj. U | - Projected umbra area in millionths of solar disc, negative values indicate | |
|
that the umbra consists of fragmented regions which cannot be separated without losing umbral area. In this way several spots (intensity minima in the umbra) have a common umbra, e.g. -2 means that the given spot shares an umbra with spot No.2, and the common U value is indicated at spot No.2. |
||
| Proj. WS | - Projected whole spot area in millionths of solar disc, negative values indicate | |
|
that several umbras have a common penumbra, e.g. -7 means that the given umbra shares a penumbra with umbra No.7, and the WS value is indicated at No.7. |
||
| Corr. U | - Corrected umbra area in millionths of solar hemisphere, for negative values see above | |
| Corr. WS | - Corrected whole spot area in millionths of solar hemisphere, for negative values see above | |
| B | - Heliographic latitude B; positive: North, negative: South | |
| L | - Heliographic longitude L | |
| LCM | - Longitudinal distance from the Sun's central meridian | |
| Pos. angle | - Position angle | |
| r | - Distance from the centre of Sun's disc in terms of Sun's radius | |
| MU | - Mean magnetic field within the umbra contour averaged the pixel values with sign. | |
| MP | - Mean magnetic field within the penumbra contour averaged the pixel values with sign. | |