SOHO MDI 1999-12-05 03:59:33 UT
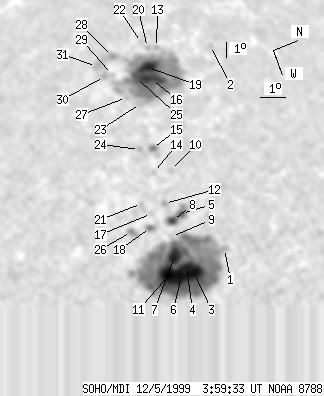
| group | Proj. U | Proj. WS | Corr. U | Corr. WS | B | L | LCM | Pos. angle | r | MU | MP |
| 161 | 1116 | 133 | 937 | 10.21 | 308.61 | -53.10 | 77.46 | 0.8031 | 414.0 | 82.9 | |
|
previous
or next observation for the same group /
back to the solar disc SOHO MDI 1999-12-05 03:59:33 UT |
| spot | Proj. U | Proj. WS | Corr. U | Corr. WS | B | L | LCM | Pos. angle | r | MU | MP |
| 0 | 6 | 0 | 4 | 11.50 | 314.27 | -47.44 | 74.85 | 0.7501 | 194.0 | 148.9 | |
| 0 | 3 | 0 | 3 | 13.77 | 300.32 | -61.39 | 74.57 | 0.8865 | 3.0 | -32.4 | |
| 20 | 603 | 15 | 442 | 10.07 | 315.29 | -46.42 | 76.54 | 0.7358 | 1511.3 | 500.4 | |
| 30 | -3 | 22 | -3 | 9.87 | 314.80 | -46.91 | 76.90 | 0.7411 | 1447.0 | 999999 | |
| 5 | 35 | 4 | 27 | 10.41 | 311.66 | -50.05 | 76.79 | 0.7768 | 370.9 | 252.1 | |
| -4 | -3 | -4 | -3 | 9.57 | 315.23 | -46.48 | 77.22 | 0.7356 | 999999 | 999999 | |
| 20 | -3 | 15 | -3 | 9.57 | 314.07 | -47.64 | 77.44 | 0.7489 | 836.6 | 999999 | |
| 6 | -5 | 4 | -5 | 9.99 | 311.96 | -49.76 | 77.28 | 0.7730 | 669.5 | 999999 | |
| 0 | 2 | 0 | 2 | 9.74 | 312.88 | -48.83 | 77.44 | 0.7625 | 344.0 | 290.8 | |
| 0 | 3 | 0 | 3 | 10.60 | 308.85 | -52.86 | 77.04 | 0.8064 | -236.0 | -229.6 | |
| 28 | -3 | 20 | -3 | 9.10 | 315.05 | -46.66 | 77.89 | 0.7369 | 1395.1 | 999999 | |
| 0 | 5 | 0 | 4 | 9.93 | 310.82 | -50.89 | 77.55 | 0.7850 | 330.0 | 297.1 | |
| 0 | 4 | 0 | 4 | 11.76 | 299.72 | -61.99 | 76.90 | 0.8894 | 48.0 | 61.7 | |
| 0 | 3 | 0 | 3 | 9.95 | 308.73 | -52.98 | 77.85 | 0.8067 | 271.0 | 230.0 | |
| 2 | 16 | 2 | 14 | 10.24 | 307.15 | -54.56 | 77.73 | 0.8227 | 268.4 | 182.1 | |
| 21 | 354 | 21 | 356 | 11.14 | 302.21 | -59.50 | 77.31 | 0.8686 | -1008.1 | -421.2 | |
| 0 | 3 | 0 | 2 | 9.32 | 311.24 | -50.47 | 78.25 | 0.7797 | 331.0 | 357.8 | |
| 2 | 8 | 2 | 6 | 9.10 | 312.06 | -49.66 | 78.42 | 0.7706 | 643.8 | 584.7 | |
| 18 | -16 | 19 | -16 | 11.16 | 301.21 | -60.50 | 77.41 | 0.8769 | -485.3 | 999999 | |
| 0 | 4 | 0 | 4 | 11.43 | 299.58 | -62.13 | 77.29 | 0.8902 | 313.0 | 223.3 | |
| 0 | 3 | 0 | 2 | 9.10 | 310.49 | -51.22 | 78.66 | 0.7874 | 284.0 | 335.7 | |
| 0 | 2 | 0 | 2 | 11.28 | 299.06 | -62.65 | 77.51 | 0.8941 | 244.0 | 254.4 | |
| 0 | 3 | 0 | 2 | 10.42 | 303.84 | -57.87 | 77.96 | 0.8537 | -532.0 | -570.1 | |
| 0 | 4 | 0 | 3 | 9.76 | 307.03 | -54.69 | 78.33 | 0.8234 | 223.0 | 173.0 | |
| 9 | -16 | 9 | -16 | 10.59 | 301.81 | -59.90 | 78.00 | 0.8715 | -923.6 | 999999 | |
| 0 | 12 | 0 | 9 | 8.35 | 312.01 | -49.70 | 79.38 | 0.7701 | -209.0 | -109.1 | |
| 0 | 3 | 0 | 3 | 9.99 | 303.18 | -58.53 | 78.53 | 0.8592 | -499.0 | -558.6 | |
| 0 | 16 | 0 | 17 | 10.03 | 299.74 | -61.97 | 78.84 | 0.8879 | 415.0 | 270.9 | |
| 0 | 2 | 0 | 2 | 9.79 | 301.19 | -60.52 | 78.98 | 0.8760 | -490.0 | -453.6 | |
| 0 | 9 | 0 | 9 | 9.47 | 301.21 | -60.50 | 79.34 | 0.8756 | -369.0 | -378.8 | |
| 0 | 13 | 0 | 14 | 9.31 | 300.27 | -61.44 | 79.60 | 0.8832 | 26.0 | -43.7 | |
| Proj. U | - Projected umbra area in millionths of solar disc, negative values indicate | |
|
that the umbra consists of fragmented regions which cannot be separated without losing umbral area. In this way several spots (intensity minima in the umbra) have a common umbra, e.g. -2 means that the given spot shares an umbra with spot No.2, and the common U value is indicated at spot No.2. |
||
| Proj. WS | - Projected whole spot area in millionths of solar disc, negative values indicate | |
|
that several umbras have a common penumbra, e.g. -7 means that the given umbra shares a penumbra with umbra No.7, and the WS value is indicated at No.7. |
||
| Corr. U | - Corrected umbra area in millionths of solar hemisphere, for negative values see above | |
| Corr. WS | - Corrected whole spot area in millionths of solar hemisphere, for negative values see above | |
| B | - Heliographic latitude B; positive: North, negative: South | |
| L | - Heliographic longitude L | |
| LCM | - Longitudinal distance from the Sun's central meridian | |
| Pos. angle | - Position angle | |
| r | - Distance from the centre of Sun's disc in terms of Sun's radius | |
| MU | - Mean magnetic field within the umbra contour averaged the pixel values with sign. | |
| MP | - Mean magnetic field within the penumbra contour averaged the pixel values with sign. | |