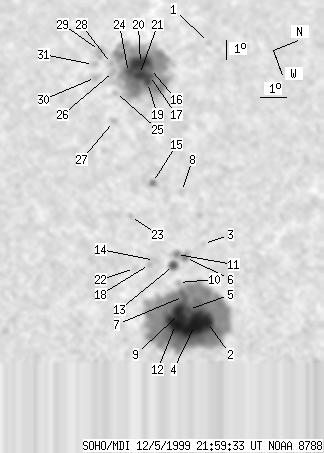
SOHO MDI 1999-12-05 21:59:33 UT
| group | Proj. U | Proj. WS | Corr. U | Corr. WS | B | L | LCM | Pos. angle | r | MU | MP |
| 184 | 1162 | 126 | 797 | 10.19 | 309.36 | -42.47 | 75.16 | 0.6845 | 594.4 | 113.9 | |
|
previous
or next observation for the same group /
back to the solar disc SOHO MDI 1999-12-05 21:59:33 UT |
| spot | Proj. U | Proj. WS | Corr. U | Corr. WS | B | L | LCM | Pos. angle | r | MU | MP |
| 0 | 5 | 0 | 4 | 14.06 | 300.73 | -51.10 | 72.34 | 0.7946 | -136.0 | -136.0 | |
| 18 | 668 | 11 | 416 | 10.15 | 315.75 | -36.08 | 73.41 | 0.6072 | 1619.3 | 602.6 | |
| 0 | 3 | 0 | 2 | 11.09 | 311.88 | -39.95 | 73.29 | 0.6603 | 534.0 | 449.0 | |
| 49 | -2 | 30 | -2 | 9.63 | 315.73 | -36.11 | 74.24 | 0.6059 | 2048.6 | 999999 | |
| 4 | -2 | 2 | -2 | 9.64 | 314.90 | -36.93 | 74.52 | 0.6170 | 945.1 | 999999 | |
| 3 | 17 | 2 | 11 | 10.24 | 312.35 | -39.48 | 74.41 | 0.6519 | 683.6 | 528.9 | |
| 4 | -2 | 3 | -2 | 9.63 | 314.22 | -37.61 | 74.75 | 0.6260 | 566.0 | 999999 | |
| 0 | 6 | 0 | 4 | 11.01 | 308.95 | -42.88 | 74.29 | 0.6962 | -370.0 | -338.7 | |
| 16 | -2 | 10 | -2 | 9.26 | 314.97 | -36.86 | 75.11 | 0.6149 | 1298.2 | 999999 | |
| 0 | 4 | 0 | 3 | 9.64 | 313.48 | -38.35 | 74.97 | 0.6357 | 512.0 | 365.2 | |
| 2 | -6 | 2 | -6 | 9.96 | 312.09 | -39.74 | 74.92 | 0.6545 | 684.8 | 999999 | |
| 24 | -2 | 15 | -2 | 8.96 | 315.44 | -36.40 | 75.43 | 0.6079 | 1830.1 | 999999 | |
| 6 | 13 | 4 | 9 | 9.70 | 312.59 | -39.24 | 75.16 | 0.6474 | 956.3 | 638.7 | |
| 0 | 4 | 0 | 3 | 9.08 | 312.10 | -39.73 | 76.25 | 0.6522 | 888.0 | 772.5 | |
| 2 | 8 | 2 | 5 | 10.07 | 308.11 | -43.72 | 75.83 | 0.7042 | 422.8 | 265.3 | |
| 2 | 378 | 1 | 298 | 11.57 | 301.65 | -50.18 | 75.27 | 0.7804 | -831.0 | -521.9 | |
| 4 | -16 | 3 | -16 | 11.44 | 302.06 | -49.77 | 75.35 | 0.7758 | -1010.6 | 999999 | |
| 0 | 3 | 0 | 2 | 8.84 | 312.23 | -39.60 | 76.57 | 0.6499 | 779.0 | 758.5 | |
| 6 | -16 | 5 | -16 | 11.27 | 302.46 | -49.38 | 75.49 | 0.7712 | -1303.1 | 999999 | |
| 28 | -16 | 22 | -16 | 11.27 | 301.22 | -50.61 | 75.73 | 0.7844 | -869.5 | 999999 | |
| 8 | -16 | 7 | -16 | 11.08 | 301.87 | -49.96 | 75.84 | 0.7772 | -1333.5 | 999999 | |
| 0 | 5 | 0 | 3 | 8.24 | 312.23 | -39.61 | 77.48 | 0.6486 | 457.0 | 500.2 | |
| 0 | 4 | 0 | 2 | 8.81 | 309.58 | -42.25 | 77.28 | 0.6835 | 530.0 | 498.9 | |
| 8 | -16 | 7 | -16 | 10.71 | 301.61 | -50.23 | 76.37 | 0.7794 | -1120.4 | 999999 | |
| 0 | 4 | 0 | 3 | 9.96 | 302.62 | -49.21 | 77.14 | 0.7673 | -872.0 | -790.8 | |
| 0 | 6 | 0 | 5 | 10.18 | 301.34 | -50.49 | 77.09 | 0.7814 | -747.0 | -720.5 | |
| 0 | 5 | 0 | 4 | 9.49 | 304.26 | -47.57 | 77.45 | 0.7482 | -755.0 | -657.8 | |
| 0 | 3 | 0 | 3 | 10.22 | 300.83 | -51.01 | 77.14 | 0.7869 | -517.0 | -475.4 | |
| 0 | 14 | 0 | 11 | 9.96 | 299.85 | -51.98 | 77.62 | 0.7967 | 346.0 | 94.8 | |
| 0 | 7 | 0 | 5 | 9.44 | 301.45 | -50.39 | 78.01 | 0.7792 | -483.0 | -481.5 | |
| 0 | 5 | 0 | 4 | 9.55 | 300.63 | -51.20 | 78.01 | 0.7880 | -368.0 | -348.5 | |
| Proj. U | - Projected umbra area in millionths of solar disc, negative values indicate | |
|
that the umbra consists of fragmented regions which cannot be separated without losing umbral area. In this way several spots (intensity minima in the umbra) have a common umbra, e.g. -2 means that the given spot shares an umbra with spot No.2, and the common U value is indicated at spot No.2. |
||
| Proj. WS | - Projected whole spot area in millionths of solar disc, negative values indicate | |
|
that several umbras have a common penumbra, e.g. -7 means that the given umbra shares a penumbra with umbra No.7, and the WS value is indicated at No.7. |
||
| Corr. U | - Corrected umbra area in millionths of solar hemisphere, for negative values see above | |
| Corr. WS | - Corrected whole spot area in millionths of solar hemisphere, for negative values see above | |
| B | - Heliographic latitude B; positive: North, negative: South | |
| L | - Heliographic longitude L | |
| LCM | - Longitudinal distance from the Sun's central meridian | |
| Pos. angle | - Position angle | |
| r | - Distance from the centre of Sun's disc in terms of Sun's radius | |
| MU | - Mean magnetic field within the umbra contour averaged the pixel values with sign. | |
| MP | - Mean magnetic field within the penumbra contour averaged the pixel values with sign. | |