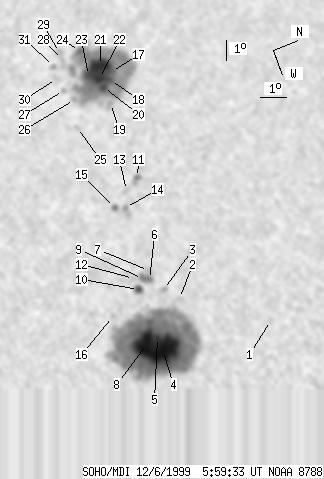
SOHO MDI 1999-12-06 05:59:33 UT
| group | Proj. U | Proj. WS | Corr. U | Corr. WS | B | L | LCM | Pos. angle | r | MU | MP |
| 202 | 1298 | 130 | 837 | 10.21 | 309.31 | -38.13 | 73.71 | 0.6301 | 547.4 | 115.3 | |
|
previous
or next observation for the same group /
back to the solar disc SOHO MDI 1999-12-06 05:59:33 UT |
| spot | Proj. U | Proj. WS | Corr. U | Corr. WS | B | L | LCM | Pos. angle | r | MU | MP |
| 0 | 4 | 0 | 3 | 14.02 | 315.84 | -31.61 | 64.80 | 0.5642 | 659.0 | 526.6 | |
| 0 | 4 | 0 | 3 | 10.99 | 313.80 | -33.65 | 70.96 | 0.5776 | -454.0 | -376.2 | |
| 0 | 6 | 0 | 3 | 10.53 | 313.19 | -34.25 | 71.99 | 0.5841 | 534.0 | 489.7 | |
| 108 | 716 | 64 | 422 | 9.68 | 315.98 | -31.47 | 72.21 | 0.5426 | 1972.6 | 664.7 | |
| 7 | -4 | 4 | -4 | 9.65 | 315.28 | -32.16 | 72.57 | 0.5522 | 1177.5 | 999999 | |
| 3 | 16 | 2 | 10 | 10.16 | 312.56 | -34.88 | 72.87 | 0.5913 | 1043.6 | 642.7 | |
| 0 | 6 | 0 | 4 | 10.25 | 312.13 | -35.31 | 72.89 | 0.5974 | 241.0 | 122.4 | |
| -4 | -4 | -4 | -4 | 9.16 | 315.45 | -31.99 | 73.37 | 0.5480 | 999999 | 999999 | |
| 4 | -6 | 2 | -6 | 9.92 | 312.43 | -35.01 | 73.31 | 0.5923 | 850.8 | 999999 | |
| 5 | 12 | 3 | 8 | 9.62 | 312.88 | -34.56 | 73.63 | 0.5852 | 879.2 | 592.1 | |
| 2 | 11 | 1 | 7 | 11.13 | 307.53 | -39.92 | 73.17 | 0.6601 | -742.2 | -545.2 | |
| 0 | 3 | 0 | 2 | 9.59 | 312.31 | -35.13 | 73.90 | 0.5928 | 605.0 | 557.5 | |
| 0 | 4 | 0 | 3 | 10.55 | 308.04 | -39.41 | 73.88 | 0.6520 | -211.0 | -88.4 | |
| 0 | 12 | 0 | 8 | 10.28 | 308.86 | -38.59 | 74.02 | 0.6407 | 433.0 | 471.5 | |
| 2 | 7 | 1 | 5 | 9.88 | 308.72 | -38.72 | 74.68 | 0.6414 | 657.8 | 398.9 | |
| 0 | 3 | 0 | 2 | 8.31 | 313.77 | -33.67 | 75.52 | 0.5688 | 406.0 | 388.2 | |
| 7 | 440 | 5 | 319 | 11.65 | 301.64 | -45.80 | 74.14 | 0.7324 | -925.3 | -560.6 | |
| 6 | -17 | 5 | -17 | 11.49 | 302.12 | -45.32 | 74.24 | 0.7264 | -1226.8 | 999999 | |
| 0 | 8 | 0 | 6 | 11.17 | 303.37 | -44.07 | 74.35 | 0.7111 | -693.0 | -747.7 | |
| 5 | -17 | 4 | -17 | 11.14 | 302.42 | -45.02 | 74.64 | 0.7222 | -1466.6 | 999999 | |
| 30 | -17 | 22 | -17 | 11.33 | 301.17 | -46.27 | 74.68 | 0.7370 | -997.0 | 999999 | |
| 8 | -17 | 6 | -17 | 11.11 | 301.88 | -45.57 | 74.80 | 0.7284 | -1519.6 | 999999 | |
| 10 | -17 | 7 | -17 | 10.75 | 301.57 | -45.87 | 75.36 | 0.7312 | -1247.4 | 999999 | |
| 5 | -17 | 4 | -17 | 10.76 | 300.11 | -47.33 | 75.69 | 0.7479 | 251.6 | 999999 | |
| 0 | 6 | 0 | 4 | 9.64 | 304.22 | -43.23 | 76.28 | 0.6974 | -823.0 | -755.4 | |
| 0 | 5 | 0 | 3 | 9.91 | 302.69 | -44.75 | 76.25 | 0.7163 | -1010.0 | -910.0 | |
| 0 | 4 | 0 | 3 | 9.64 | 302.06 | -45.38 | 76.77 | 0.7233 | -660.0 | -578.0 | |
| 0 | 8 | 0 | 6 | 10.03 | 300.34 | -47.10 | 76.61 | 0.7439 | -361.0 | -427.8 | |
| 0 | 10 | 0 | 7 | 10.02 | 299.90 | -47.54 | 76.71 | 0.7489 | 300.0 | 131.0 | |
| 0 | 8 | 0 | 5 | 9.55 | 301.31 | -46.13 | 77.05 | 0.7319 | -427.0 | -371.8 | |
| 0 | 5 | 0 | 4 | 9.60 | 300.61 | -46.84 | 77.12 | 0.7401 | -519.0 | -423.7 | |
| Proj. U | - Projected umbra area in millionths of solar disc, negative values indicate | |
|
that the umbra consists of fragmented regions which cannot be separated without losing umbral area. In this way several spots (intensity minima in the umbra) have a common umbra, e.g. -2 means that the given spot shares an umbra with spot No.2, and the common U value is indicated at spot No.2. |
||
| Proj. WS | - Projected whole spot area in millionths of solar disc, negative values indicate | |
|
that several umbras have a common penumbra, e.g. -7 means that the given umbra shares a penumbra with umbra No.7, and the WS value is indicated at No.7. |
||
| Corr. U | - Corrected umbra area in millionths of solar hemisphere, for negative values see above | |
| Corr. WS | - Corrected whole spot area in millionths of solar hemisphere, for negative values see above | |
| B | - Heliographic latitude B; positive: North, negative: South | |
| L | - Heliographic longitude L | |
| LCM | - Longitudinal distance from the Sun's central meridian | |
| Pos. angle | - Position angle | |
| r | - Distance from the centre of Sun's disc in terms of Sun's radius | |
| MU | - Mean magnetic field within the umbra contour averaged the pixel values with sign. | |
| MP | - Mean magnetic field within the penumbra contour averaged the pixel values with sign. | |