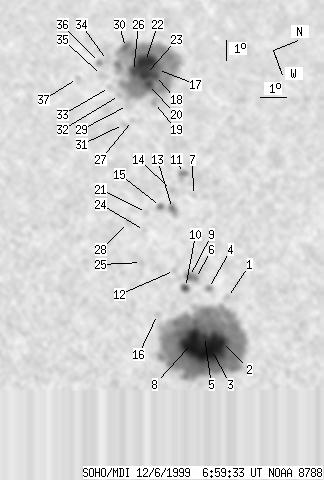
SOHO MDI 1999-12-06 06:59:33 UT
| group | Proj. U | Proj. WS | Corr. U | Corr. WS | B | L | LCM | Pos. angle | r | MU | MP |
| 215 | 1331 | 136 | 850 | 10.17 | 309.45 | -37.44 | 73.51 | 0.6212 | 566.4 | 99.3 | |
|
previous
or next observation for the same group /
back to the solar disc SOHO MDI 1999-12-06 06:59:33 UT |
| spot | Proj. U | Proj. WS | Corr. U | Corr. WS | B | L | LCM | Pos. angle | r | MU | MP |
| 0 | 4 | 0 | 2 | 11.04 | 313.86 | -33.03 | 70.58 | 0.5695 | -568.0 | -365.0 | |
| 10 | 737 | 6 | 432 | 10.20 | 315.80 | -31.09 | 71.09 | 0.5395 | 1464.7 | 634.7 | |
| 57 | -2 | 33 | -2 | 9.74 | 315.98 | -30.91 | 71.82 | 0.5351 | 2102.6 | 999999 | |
| 0 | 7 | 0 | 4 | 10.47 | 313.23 | -33.67 | 71.83 | 0.5760 | 728.0 | 470.0 | |
| 8 | -2 | 5 | -2 | 9.66 | 315.32 | -31.57 | 72.28 | 0.5440 | 1165.8 | 999999 | |
| 2 | 17 | 1 | 11 | 10.14 | 312.61 | -34.28 | 72.66 | 0.5832 | 960.0 | 694.9 | |
| 0 | 5 | 0 | 3 | 11.21 | 308.67 | -38.22 | 72.47 | 0.6388 | -548.0 | -414.2 | |
| 50 | -2 | 29 | -2 | 9.10 | 315.47 | -31.42 | 73.23 | 0.5399 | 1731.6 | 999999 | |
| 5 | -6 | 3 | -6 | 9.95 | 312.44 | -34.45 | 73.04 | 0.5848 | 846.6 | 999999 | |
| 5 | 11 | 3 | 7 | 9.65 | 312.90 | -34.00 | 73.36 | 0.5776 | 876.8 | 559.3 | |
| 3 | 10 | 2 | 7 | 11.15 | 307.47 | -39.42 | 72.98 | 0.6540 | -640.0 | -616.6 | |
| 0 | 4 | 0 | 3 | 9.48 | 311.98 | -34.91 | 73.99 | 0.5896 | 515.0 | 463.3 | |
| 4 | 12 | 2 | 8 | 10.27 | 309.04 | -37.85 | 73.79 | 0.6311 | 510.6 | 495.4 | |
| 0 | 4 | 0 | 3 | 10.48 | 308.16 | -38.73 | 73.76 | 0.6432 | 79.0 | -69.0 | |
| 3 | 6 | 2 | 4 | 9.86 | 308.80 | -38.10 | 74.51 | 0.6331 | 588.1 | 469.8 | |
| 0 | 6 | 0 | 3 | 8.26 | 313.75 | -33.14 | 75.41 | 0.5613 | 374.0 | 227.9 | |
| 3 | 428 | 2 | 308 | 11.64 | 301.74 | -45.15 | 73.98 | 0.7248 | -974.8 | -575.1 | |
| 7 | -17 | 5 | -17 | 11.48 | 302.05 | -44.85 | 74.12 | 0.7209 | -1158.3 | 999999 | |
| 0 | 10 | 0 | 7 | 11.07 | 303.48 | -43.41 | 74.30 | 0.7030 | -912.0 | -784.4 | |
| 4 | -17 | 3 | -17 | 11.10 | 302.45 | -44.45 | 74.53 | 0.7153 | -1545.0 | 999999 | |
| 0 | 4 | 0 | 3 | 9.27 | 308.91 | -37.99 | 75.39 | 0.6301 | 416.0 | 325.8 | |
| 29 | -17 | 21 | -17 | 11.31 | 301.15 | -45.74 | 74.57 | 0.7309 | -943.2 | 999999 | |
| 11 | -17 | 8 | -17 | 11.13 | 301.87 | -45.03 | 74.64 | 0.7222 | -1494.2 | 999999 | |
| 0 | 3 | 0 | 2 | 8.95 | 309.73 | -37.16 | 75.64 | 0.6182 | 538.0 | 454.9 | |
| 0 | 4 | 0 | 3 | 8.40 | 311.19 | -35.71 | 76.06 | 0.5972 | 626.0 | 572.2 | |
| 8 | -17 | 6 | -17 | 10.74 | 301.55 | -45.34 | 75.26 | 0.7250 | -1184.4 | 999999 | |
| 0 | 4 | 0 | 2 | 10.02 | 304.15 | -42.75 | 75.60 | 0.6924 | -500.0 | -472.6 | |
| 0 | 8 | 0 | 5 | 8.48 | 309.15 | -37.75 | 76.56 | 0.6249 | 630.0 | 539.7 | |
| 0 | 4 | 0 | 3 | 10.05 | 303.30 | -43.60 | 75.78 | 0.7028 | -441.0 | -355.1 | |
| 6 | -17 | 5 | -17 | 10.77 | 300.12 | -46.77 | 75.54 | 0.7416 | 315.4 | 999999 | |
| 0 | 6 | 0 | 4 | 9.64 | 304.24 | -42.66 | 76.13 | 0.6905 | -778.0 | -765.2 | |
| 0 | 4 | 0 | 3 | 9.90 | 302.66 | -44.23 | 76.15 | 0.7101 | -971.0 | -874.5 | |
| 0 | 4 | 0 | 3 | 9.64 | 302.10 | -44.79 | 76.63 | 0.7163 | -645.0 | -574.3 | |
| 0 | 8 | 0 | 6 | 9.94 | 300.61 | -46.29 | 76.55 | 0.7344 | -393.0 | -368.8 | |
| 0 | 9 | 0 | 6 | 9.52 | 301.35 | -45.55 | 76.97 | 0.7250 | -300.0 | -340.8 | |
| 0 | 6 | 0 | 4 | 9.62 | 300.61 | -46.28 | 76.98 | 0.7338 | -572.0 | -417.3 | |
| 0 | 6 | 0 | 4 | 8.61 | 301.18 | -45.72 | 78.25 | 0.7254 | -515.0 | -420.3 | |
| Proj. U | - Projected umbra area in millionths of solar disc, negative values indicate | |
|
that the umbra consists of fragmented regions which cannot be separated without losing umbral area. In this way several spots (intensity minima in the umbra) have a common umbra, e.g. -2 means that the given spot shares an umbra with spot No.2, and the common U value is indicated at spot No.2. |
||
| Proj. WS | - Projected whole spot area in millionths of solar disc, negative values indicate | |
|
that several umbras have a common penumbra, e.g. -7 means that the given umbra shares a penumbra with umbra No.7, and the WS value is indicated at No.7. |
||
| Corr. U | - Corrected umbra area in millionths of solar hemisphere, for negative values see above | |
| Corr. WS | - Corrected whole spot area in millionths of solar hemisphere, for negative values see above | |
| B | - Heliographic latitude B; positive: North, negative: South | |
| L | - Heliographic longitude L | |
| LCM | - Longitudinal distance from the Sun's central meridian | |
| Pos. angle | - Position angle | |
| r | - Distance from the centre of Sun's disc in terms of Sun's radius | |
| MU | - Mean magnetic field within the umbra contour averaged the pixel values with sign. | |
| MP | - Mean magnetic field within the penumbra contour averaged the pixel values with sign. | |