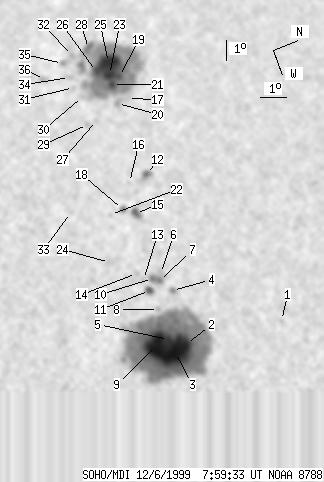
SOHO MDI 1999-12-06 07:59:33 UT
| group | Proj. U | Proj. WS | Corr. U | Corr. WS | B | L | LCM | Pos. angle | r | MU | MP |
| 221 | 1293 | 138 | 817 | 10.26 | 309.56 | -36.78 | 73.07 | 0.6130 | 568.4 | 99.1 | |
|
previous
or next observation for the same group /
back to the solar disc SOHO MDI 1999-12-06 07:59:33 UT |
| spot | Proj. U | Proj. WS | Corr. U | Corr. WS | B | L | LCM | Pos. angle | r | MU | MP |
| 0 | 3 | 0 | 2 | 14.03 | 315.83 | -30.51 | 64.06 | 0.5499 | 792.0 | 691.4 | |
| 118 | 726 | 69 | 424 | 10.24 | 315.76 | -30.59 | 70.75 | 0.5326 | 1943.0 | 633.2 | |
| -2 | -2 | -2 | -2 | 9.71 | 316.01 | -30.33 | 71.57 | 0.5268 | 999999 | 999999 | |
| 0 | 7 | 0 | 4 | 10.46 | 313.23 | -33.11 | 71.59 | 0.5684 | 752.0 | 477.0 | |
| 8 | -2 | 4 | -2 | 9.64 | 315.36 | -30.99 | 72.03 | 0.5357 | 1215.3 | 999999 | |
| 0 | 2 | 0 | 1 | 10.26 | 312.31 | -34.03 | 72.34 | 0.5802 | 21.0 | 34.4 | |
| 3 | 15 | 2 | 9 | 10.13 | 312.62 | -33.73 | 72.43 | 0.5756 | 821.9 | 712.5 | |
| 0 | 4 | 0 | 2 | 9.69 | 313.91 | -32.44 | 72.62 | 0.5562 | 234.0 | 111.7 | |
| -2 | -2 | -2 | -2 | 9.12 | 315.47 | -30.87 | 72.92 | 0.5322 | 999999 | 999999 | |
| 3 | -7 | 2 | -7 | 9.90 | 312.44 | -33.90 | 72.89 | 0.5772 | 823.1 | 999999 | |
| 5 | 11 | 3 | 7 | 9.62 | 312.95 | -33.40 | 73.14 | 0.5693 | 822.9 | 572.9 | |
| 4 | 17 | 2 | 11 | 11.12 | 307.46 | -38.89 | 72.84 | 0.6471 | -776.3 | -657.5 | |
| 0 | 2 | 0 | 1 | 9.56 | 312.37 | -33.97 | 73.49 | 0.5770 | 687.0 | 600.6 | |
| 0 | 3 | 0 | 2 | 9.39 | 312.01 | -34.33 | 73.92 | 0.5814 | 682.0 | 596.3 | |
| 6 | 14 | 4 | 9 | 10.18 | 309.21 | -37.14 | 73.67 | 0.6215 | 556.5 | 505.7 | |
| 0 | 2 | 0 | 1 | 10.39 | 307.64 | -38.70 | 73.88 | 0.6426 | 405.0 | 355.2 | |
| 0 | 6 | 0 | 4 | 11.47 | 303.37 | -42.98 | 73.61 | 0.6988 | -408.0 | -494.9 | |
| 2 | 7 | 1 | 4 | 9.76 | 308.85 | -37.49 | 74.45 | 0.6249 | 551.0 | 438.3 | |
| 5 | 416 | 3 | 296 | 11.49 | 302.10 | -44.25 | 73.95 | 0.7139 | -1234.3 | -593.6 | |
| 0 | 8 | 0 | 6 | 11.04 | 303.51 | -42.84 | 74.18 | 0.6960 | -915.0 | -832.1 | |
| 6 | -19 | 4 | -19 | 11.12 | 302.44 | -43.91 | 74.36 | 0.7090 | -1543.0 | 999999 | |
| 0 | 3 | 0 | 2 | 9.26 | 308.94 | -37.41 | 75.22 | 0.6224 | 274.0 | 373.4 | |
| 12 | -19 | 8 | -19 | 11.15 | 301.86 | -44.48 | 74.47 | 0.7159 | -1494.6 | 999999 | |
| 0 | 5 | 0 | 3 | 8.56 | 311.16 | -35.18 | 75.61 | 0.5905 | 232.0 | 365.2 | |
| 36 | -19 | 26 | -19 | 11.28 | 301.20 | -45.14 | 74.46 | 0.7239 | -1022.4 | 999999 | |
| 8 | -19 | 6 | -19 | 10.72 | 301.54 | -44.81 | 75.15 | 0.7187 | -1168.9 | 999999 | |
| 0 | 3 | 0 | 2 | 10.04 | 304.12 | -42.22 | 75.44 | 0.6861 | -649.0 | -605.8 | |
| 5 | -19 | 4 | -19 | 10.74 | 300.18 | -46.17 | 75.44 | 0.7346 | 261.0 | 999999 | |
| 0 | 5 | 0 | 3 | 9.66 | 304.21 | -42.13 | 75.96 | 0.6841 | -676.0 | -728.1 | |
| 0 | 3 | 0 | 2 | 9.86 | 302.69 | -43.65 | 76.05 | 0.7031 | -969.0 | -918.2 | |
| 0 | 5 | 0 | 4 | 9.66 | 302.10 | -44.25 | 76.48 | 0.7099 | -605.0 | -538.5 | |
| 0 | 4 | 0 | 3 | 10.06 | 300.35 | -45.99 | 76.31 | 0.7313 | -240.0 | -237.0 | |
| 0 | 3 | 0 | 2 | 7.84 | 308.31 | -38.03 | 77.64 | 0.6271 | 421.0 | 388.4 | |
| 0 | 5 | 0 | 3 | 9.65 | 301.51 | -44.84 | 76.62 | 0.7169 | -655.0 | -547.5 | |
| 0 | 5 | 0 | 4 | 9.59 | 300.66 | -45.69 | 76.89 | 0.7268 | -553.0 | -443.8 | |
| 0 | 9 | 0 | 6 | 8.72 | 301.27 | -45.07 | 77.96 | 0.7179 | -543.0 | -431.8 | |
| Proj. U | - Projected umbra area in millionths of solar disc, negative values indicate | |
|
that the umbra consists of fragmented regions which cannot be separated without losing umbral area. In this way several spots (intensity minima in the umbra) have a common umbra, e.g. -2 means that the given spot shares an umbra with spot No.2, and the common U value is indicated at spot No.2. |
||
| Proj. WS | - Projected whole spot area in millionths of solar disc, negative values indicate | |
|
that several umbras have a common penumbra, e.g. -7 means that the given umbra shares a penumbra with umbra No.7, and the WS value is indicated at No.7. |
||
| Corr. U | - Corrected umbra area in millionths of solar hemisphere, for negative values see above | |
| Corr. WS | - Corrected whole spot area in millionths of solar hemisphere, for negative values see above | |
| B | - Heliographic latitude B; positive: North, negative: South | |
| L | - Heliographic longitude L | |
| LCM | - Longitudinal distance from the Sun's central meridian | |
| Pos. angle | - Position angle | |
| r | - Distance from the centre of Sun's disc in terms of Sun's radius | |
| MU | - Mean magnetic field within the umbra contour averaged the pixel values with sign. | |
| MP | - Mean magnetic field within the penumbra contour averaged the pixel values with sign. | |