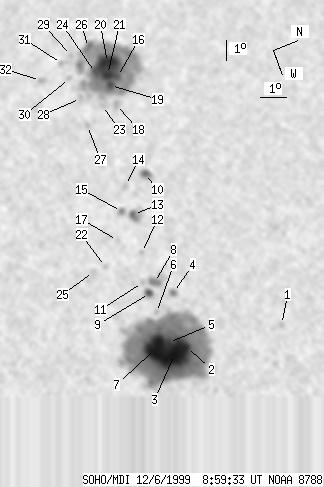
SOHO MDI 1999-12-06 08:59:33 UT
| group | Proj. U | Proj. WS | Corr. U | Corr. WS | B | L | LCM | Pos. angle | r | MU | MP |
| 215 | 1351 | 134 | 848 | 10.15 | 309.64 | -36.15 | 73.03 | 0.6043 | 590.0 | 107.0 | |
|
previous
or next observation for the same group /
back to the solar disc SOHO MDI 1999-12-06 08:59:33 UT |
| spot | Proj. U | Proj. WS | Corr. U | Corr. WS | B | L | LCM | Pos. angle | r | MU | MP |
| 0 | 4 | 0 | 2 | 14.02 | 315.93 | -29.87 | 63.63 | 0.5415 | 767.0 | 599.3 | |
| 13 | 746 | 7 | 433 | 10.23 | 315.84 | -29.96 | 70.42 | 0.5237 | 1468.6 | 634.0 | |
| 103 | -2 | 60 | -2 | 9.70 | 315.99 | -29.80 | 71.32 | 0.5193 | 2059.9 | 999999 | |
| 2 | 8 | 1 | 5 | 10.52 | 313.25 | -32.54 | 71.22 | 0.5609 | 688.6 | 408.0 | |
| 5 | -2 | 3 | -2 | 9.64 | 315.40 | -30.40 | 71.72 | 0.5275 | 1226.2 | 999999 | |
| 0 | 4 | 0 | 2 | 9.62 | 313.93 | -31.86 | 72.47 | 0.5480 | 290.0 | 149.0 | |
| -3 | -2 | -3 | -2 | 9.09 | 315.50 | -30.30 | 72.69 | 0.5239 | 999999 | 999999 | |
| 6 | 29 | 4 | 18 | 9.96 | 312.57 | -33.23 | 72.48 | 0.5682 | 918.4 | 374.3 | |
| 6 | 12 | 3 | 7 | 9.63 | 313.00 | -32.79 | 72.87 | 0.5610 | 819.7 | 518.7 | |
| 6 | 17 | 4 | 11 | 11.14 | 307.35 | -38.44 | 72.64 | 0.6415 | -960.6 | -714.4 | |
| 0 | 4 | 0 | 2 | 9.53 | 312.42 | -33.38 | 73.29 | 0.5687 | 568.0 | 490.8 | |
| 0 | 3 | 0 | 2 | 9.91 | 311.04 | -34.75 | 73.22 | 0.5888 | 452.0 | 334.9 | |
| 4 | 19 | 3 | 12 | 10.14 | 309.17 | -36.62 | 73.54 | 0.6146 | 738.3 | 461.2 | |
| 0 | 4 | 0 | 3 | 10.25 | 307.69 | -38.11 | 73.89 | 0.6344 | 487.0 | 413.4 | |
| 2 | 7 | 1 | 4 | 9.74 | 308.88 | -36.91 | 74.27 | 0.6173 | 592.1 | 467.0 | |
| 7 | 430 | 5 | 303 | 11.46 | 302.07 | -43.73 | 73.83 | 0.7077 | -1254.8 | -593.9 | |
| 0 | 3 | 0 | 2 | 9.20 | 310.19 | -35.61 | 74.70 | 0.5982 | 219.0 | 231.7 | |
| 0 | 9 | 0 | 6 | 11.04 | 303.53 | -42.26 | 74.02 | 0.6891 | -873.0 | -807.7 | |
| 5 | -16 | 3 | -16 | 11.08 | 302.46 | -43.33 | 74.25 | 0.7021 | -1535.7 | 999999 | |
| 31 | -16 | 22 | -16 | 11.29 | 301.19 | -44.60 | 74.30 | 0.7176 | -1080.7 | 999999 | |
| 11 | -16 | 8 | -16 | 11.13 | 301.84 | -43.96 | 74.36 | 0.7096 | -1539.8 | 999999 | |
| 0 | 5 | 0 | 3 | 8.41 | 311.22 | -34.57 | 75.65 | 0.5817 | 656.0 | 525.8 | |
| 0 | 8 | 0 | 6 | 10.51 | 303.41 | -42.39 | 74.80 | 0.6893 | -782.0 | -522.4 | |
| 8 | -16 | 6 | -16 | 10.72 | 301.58 | -44.21 | 75.00 | 0.7117 | -1255.6 | 999999 | |
| 0 | 8 | 0 | 5 | 7.91 | 311.29 | -34.51 | 76.48 | 0.5793 | 580.0 | 421.1 | |
| 6 | -16 | 4 | -16 | 10.81 | 300.14 | -45.66 | 75.23 | 0.7289 | 297.4 | 999999 | |
| 0 | 4 | 0 | 3 | 9.69 | 304.24 | -41.56 | 75.76 | 0.6770 | -861.0 | -730.1 | |
| 0 | 6 | 0 | 4 | 9.81 | 302.76 | -43.03 | 75.97 | 0.6955 | -946.0 | -810.8 | |
| 0 | 4 | 0 | 3 | 10.08 | 300.35 | -45.44 | 76.17 | 0.7249 | -321.0 | -251.1 | |
| 0 | 4 | 0 | 3 | 9.69 | 301.56 | -44.23 | 76.43 | 0.7097 | -630.0 | -513.8 | |
| 0 | 7 | 0 | 5 | 9.60 | 300.65 | -45.14 | 76.75 | 0.7204 | -511.0 | -466.7 | |
| 0 | 6 | 0 | 4 | 8.61 | 301.27 | -44.52 | 78.00 | 0.7112 | -621.0 | -510.0 | |
| Proj. U | - Projected umbra area in millionths of solar disc, negative values indicate | |
|
that the umbra consists of fragmented regions which cannot be separated without losing umbral area. In this way several spots (intensity minima in the umbra) have a common umbra, e.g. -2 means that the given spot shares an umbra with spot No.2, and the common U value is indicated at spot No.2. |
||
| Proj. WS | - Projected whole spot area in millionths of solar disc, negative values indicate | |
|
that several umbras have a common penumbra, e.g. -7 means that the given umbra shares a penumbra with umbra No.7, and the WS value is indicated at No.7. |
||
| Corr. U | - Corrected umbra area in millionths of solar hemisphere, for negative values see above | |
| Corr. WS | - Corrected whole spot area in millionths of solar hemisphere, for negative values see above | |
| B | - Heliographic latitude B; positive: North, negative: South | |
| L | - Heliographic longitude L | |
| LCM | - Longitudinal distance from the Sun's central meridian | |
| Pos. angle | - Position angle | |
| r | - Distance from the centre of Sun's disc in terms of Sun's radius | |
| MU | - Mean magnetic field within the umbra contour averaged the pixel values with sign. | |
| MP | - Mean magnetic field within the penumbra contour averaged the pixel values with sign. | |